Current 30-Year Fixed Mortgage Rates Overview
"This page dedicated to current 30-year fixed mortgage rates offers a comprehensive and up-to-date overview of mortgage rate trends and financial market insights. This resource is designed to assist homeowners and potential buyers in understanding the landscape of mortgage rates, providing valuable context for financial decisions. With detailed analysis and easy-to-understand graphs, the page presents a snapshot of current rates, alongside key economic indicators that influence these rates. Whether you're considering refinancing, purchasing a new home, or simply staying informed about market conditions, this page serves as an essential tool for navigating the complex world of mortgage financing."
ERATE's Daily Rate Summary
August 14, 2017
Mortgage Rates and Treasury Yields Fall.
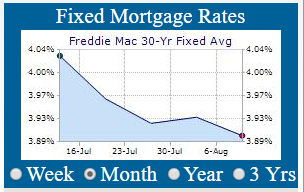
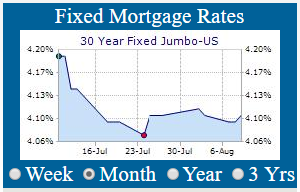
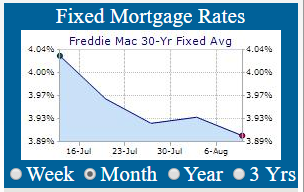
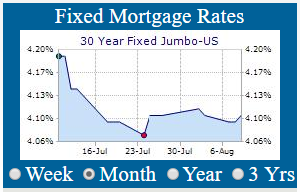
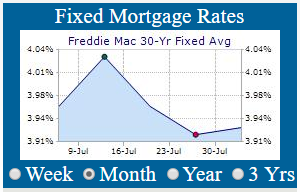
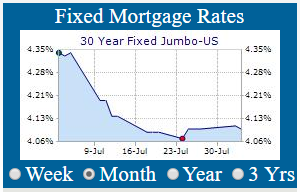
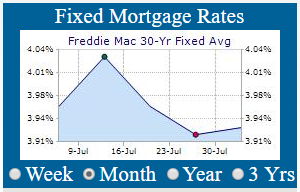
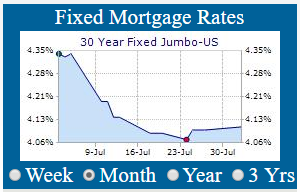
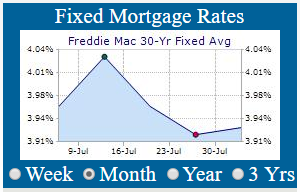
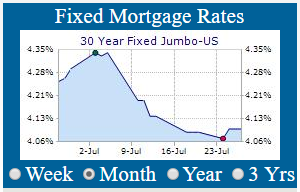
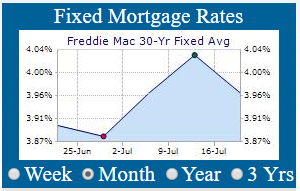
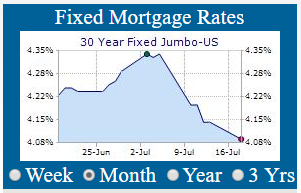
On Friday, Treasury bond yields and Mortgage interest rates fell as Credit Market participants bet on volatility and interest rate moderation in ‘quiet’ period in August. The September 10 Yr. U.S. Treasury Note stood at a yield of 2.1888% and the 30 Yr. U.S. Treasury Bond is yielding 2.7855%. 30 Year Mortgages according to Freddie Mac were around 3.90% for conforming and 4.10% for Jumbo products.
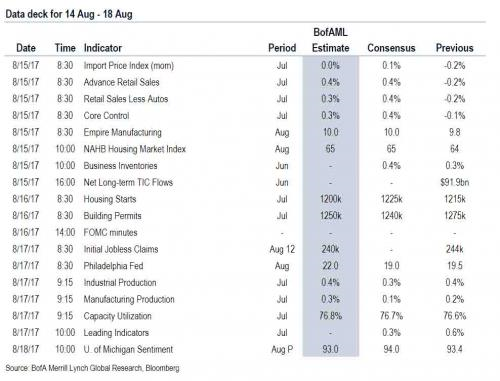
There are a number of key data releases for the Week of Aug 14th through Aug 18th. According to Goldman Sachs, the key economic data releases this week are retail sales on Tuesday and industrial production on Thursday. There are a few scheduled speaking engagements by Fed officials this week. In addition, the minutes from the July FOMC meeting will be released on Wednesday.
Goldman Sachs: Key Data Releases for Week of Aug 14th to Aug 18th
(Chart courtesy of Zerohedge.com).
This week should provide confirmation of the direction of economic activity and the pace of the recovery and further confirm the path for the economy and interest rate policy. The Jackson Hole Symposium will kick off next week. A lot will depend on inflationary expectations as CB’s assess ‘animal spirits’ and incoming economic data toward further tightening of interest rates & balance sheet normalization policy.
30 Year U.S. Treasury Bond Yield fall to 2.7972% then steadies at 2.7855%
(Chart courtesy of Zerohedge.com).
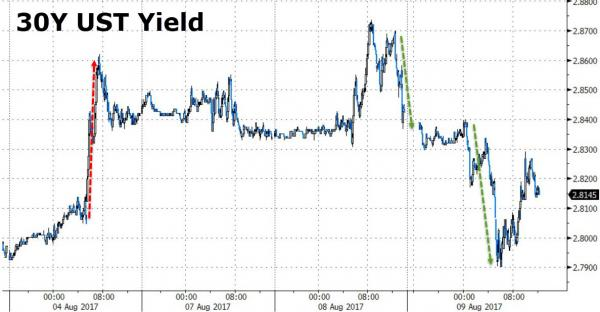
The 30 Year U.S. Treasury Bond has now extended its trading range to below 2.80% and may be presaging lower yields and a new lower trading range.
30 Year U.S. Treasury Bond Yield Testing lower range between 2.80% and 2.94%.
(Chart courtesy of Zerohedge.com).
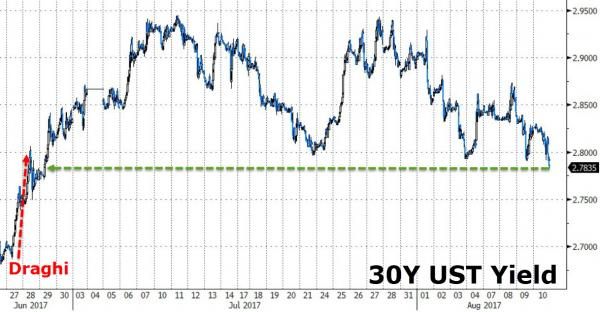
At the extremes of this range buyers of long bonds can be counted on to appears in force when the 30 Year U.S. Treasury Yield moves to the top of this range around 2.94%; conversely, sellers come out when the yield falls to 2.80%.
10 Year U.S. Treasury Note Yield Falls to 2.2212% then steadies at 2.1888%
(Chart courtesy of Zerohedge.com).
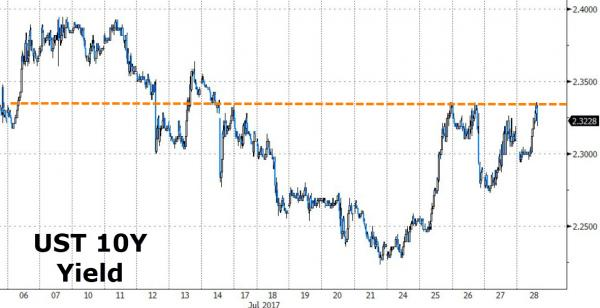
This gyration in bond yields looks like it wants to resolve itself by moving much lower into the gap that was formed post-election last November. If so, we will get another run at historically low rates before the final blow-off in Credit Markets sends Mortgage Interest rates up for good.
10 Year U.S. Treasury Note Yield Longer-term View back below 50-Day MA at 2.26%
(Chart courtesy of Zerohedge.com).
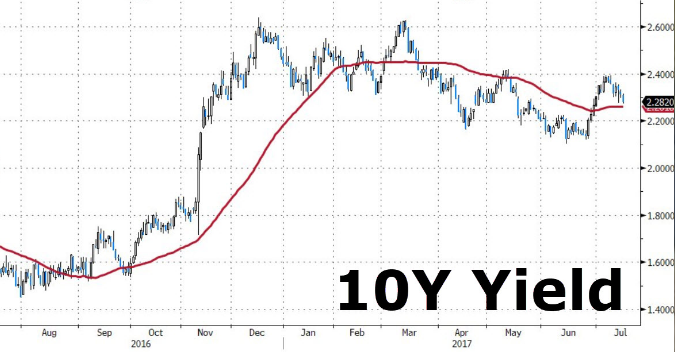
The above Chart does suggest that a constructive set-up is forming in the 10 Year Treasury Note with the potential to push the yield to around 2.00% over the next month. It is crucial that Mortgage Rates stay at or below 4.00% or demand for mortgage loans will dry up. The window of opportunity for borrowers seeking mortgage refinancing & home purchases is still open for now.
Weekly Mortgage Rates Analysis
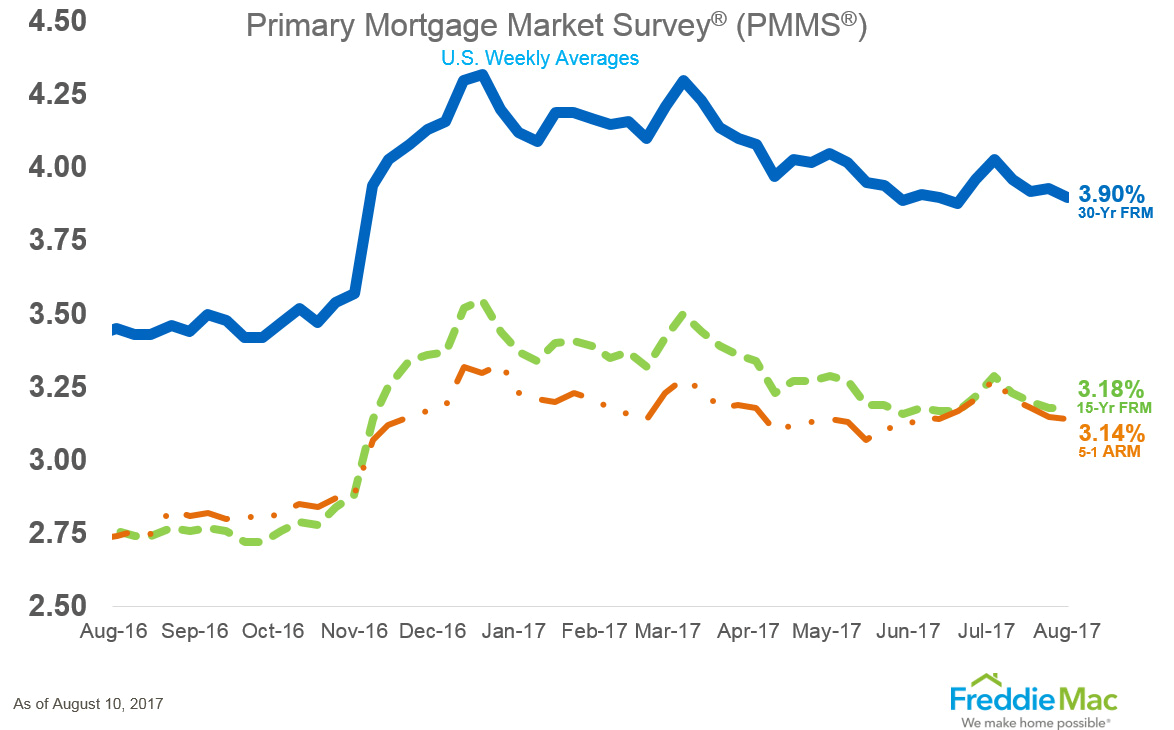
As can be seen from Freddie Mac’s Mortgage Market Survey, last week, 30 Yr. Fixed Mortgage rates for conforming loans hit 3.90% with the rate falling 0.03% basis points from the previous week.
Treasury Prices Rise and Yields Fall for U.S. 10 Yr. and 30 Yr. Treasuries.
At the Chicago Board of Trade (CBOT): the US 10 Year Treasury Note futures Contract for September settlement closed at a price of 126’26 / 32nds; the 10 Year Note was up 8 basis points (bps) on the day, yielding 2.1888%. The US 30 Year Treasury Bond futures Contract for Sept. settlement closed at a price of 155’15 / 32nds; the 30 Year Bond was up 4 basis points (bps) on the day, yielding 2.7855%. Mortgage Rates have come off their 2017 lows and are down 0.03% bps from the previous Freddie Mac Survey last week.
Thanks to ZeroHedge.com, Goldman Sachs, Bloomberg.com, and FreddieMac.com for Charts and Graphics.
With the 30 year fixed rate mortgage, the interest rate remains the same from day one, meaning borrowers can depend on the same bill amount from month to month and year to year. For the 30-year term, borrowers pay down the principal, or actual loan amount, along with unchanging interest amount on the mortgage. Homeowners gradually increase equity in the home over time. A 30 year fixed-rate mortgage is often perfect for budgeting homeowners who wish to stay in the same house for a long time, but does have the drawback of paying more interest over the length of the loan compared with shorter-term loans.
Freddie Mac Weekly Rate Summary
30-year fixed-rate mortgage (FRM) averaged 3.59 percent with an average 0.5 point for the week ending April 7, 2016, down from last week when they averaged 3.71 percent. A year ago at this time, the 30-year FRM averaged 3.66 percent.
15-year FRM this week averaged 2.88 percent with an average 0.4 point, down from last week when it averaged 2.98 percent. A year ago at this time, the 15-year FRM averaged 2.93 percent.
5-year Treasury-indexed hybrid adjustable-rate mortgage (ARM) averaged 2.82 percent this week with an average 0.5 point, down from last week when it averaged 2.90 percent. A year ago, the 5-year ARM averaged 2.83 percent.
ERATE's Daily Rate Summary
August 11, 2017
Mortgage Rates and Treasury Yields Fall.
On Thursday, Treasury bond yields and Mortgage interest rates fell as Credit Market participants bet on volatility and interest rate moderation in ‘quiet’ period in August. The September 10 Yr. U.S. Treasury Note stood at a yield of 2.1975% and the 30 Yr. U.S. Treasury Bond is yielding 2.7729%. 30 Year Mortgages according to Freddie Mac were around 3.90% for conforming and 4.10% for Jumbo products.
The Commerce Department released Core Consumer Price Index and the reading came in at 1.7% below the hoped for 2.00% inflation target the Fed was expecting. On the heels of 'disappointing' (to some) producer price data, consumer prices missed expectations for the 5th month in a row with a mere 0.1% rise MoM (0.2% exp). Year-over-year growth in core consumer prices also slowed for the 7th straight month dropping to just 1.7% - the slowest since Jan 2015. Amid this dismal report, there is a silver lining for Americans, the cost of shelter rose just 0.1% - the smallest rise since March.
Core Consumer Price Index Falls to 1.70% (YoY)
(Chart courtesy of Zerohedge.com).
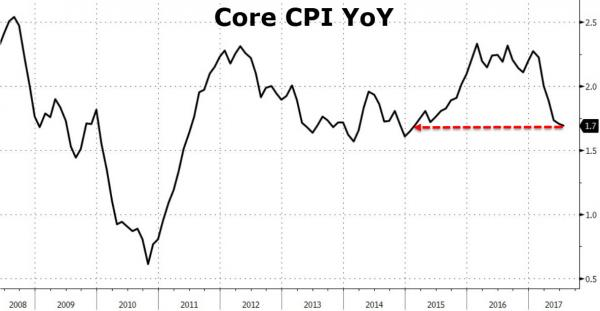
This is an unwelcome signpost for Central Planners trying desperately to conjure some inflationary ‘animal spirits’ to assist them in their interest rate raising & balance sheet normalization policy trip.
30 Year U.S. Treasury Bond Yield fall to 2.7972% then steadies at 2.7729%
(Chart courtesy of Zerohedge.com).
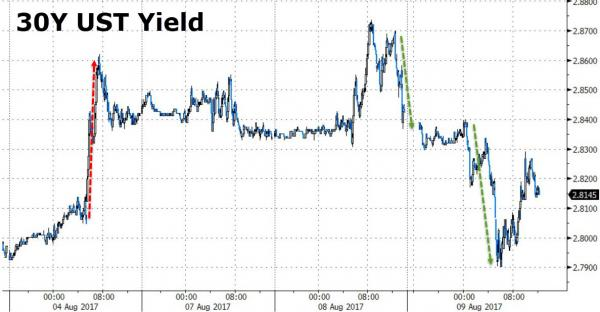
The 30 Year U.S. Treasury Bond is now expanded its trading range between 2.80% and 2.94%; as market participants try to guess whether we get a manufacturing recovery this summer or we dip back into recession in the real-goods producing sector of the economy.
30 Year U.S. Treasury Bond Yield Rangebound between 2.80% and 2.94%.
(Chart courtesy of Zerohedge.com).
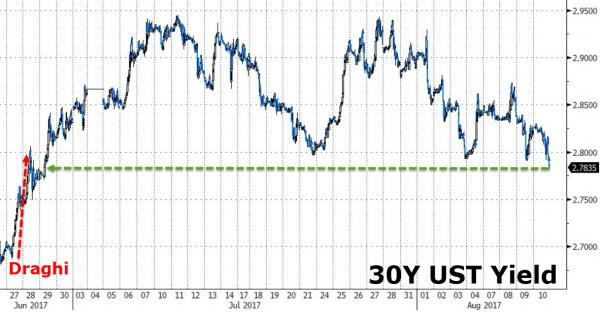
At the extremes of this range buyers of long bonds can be counted on to appears in force when the 30 Year U.S. Treasury Yield moves to the top of this range around 2.94%; conversely, sellers come out when the yield falls to 2.80%.
10 Year U.S. Treasury Note Yield Falls to 2.2212% then steadies at 2.1975%
(Chart courtesy of Zerohedge.com).
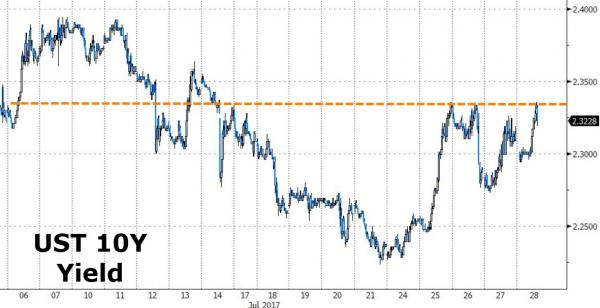
This gyration in bond yields looks like it wants to resolve itself by moving much lower into the gap that was formed post-election last November. If so, we will get another run at historically low rates before the final blow-off in Credit Markets sends Mortgage Interest rates up for good.
10 Year U.S. Treasury Note Yield Longer-term View back below 50-Day MA at 2.26%
(Chart courtesy of Zerohedge.com).
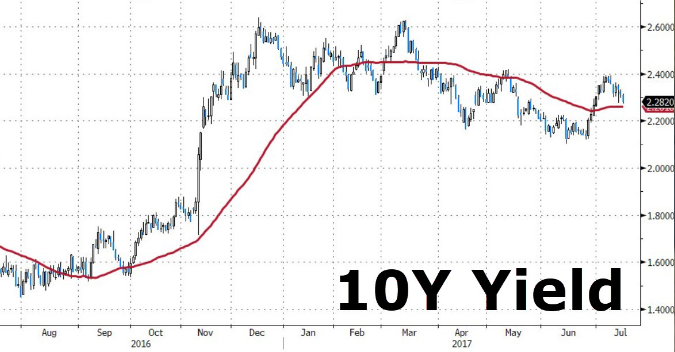
The above Chart does suggest that a constructive set-up is forming in the 10 Year Treasury Note with the potential to push the yield to around 2.00% over the next month. It is crucial that Mortgage Rates stay at or below 4.00% or demand for mortgage loans will dry up. The window of opportunity for borrowers seeking mortgage refinancing & home purchases is still open for now.
Weekly Mortgage Rates Analysis
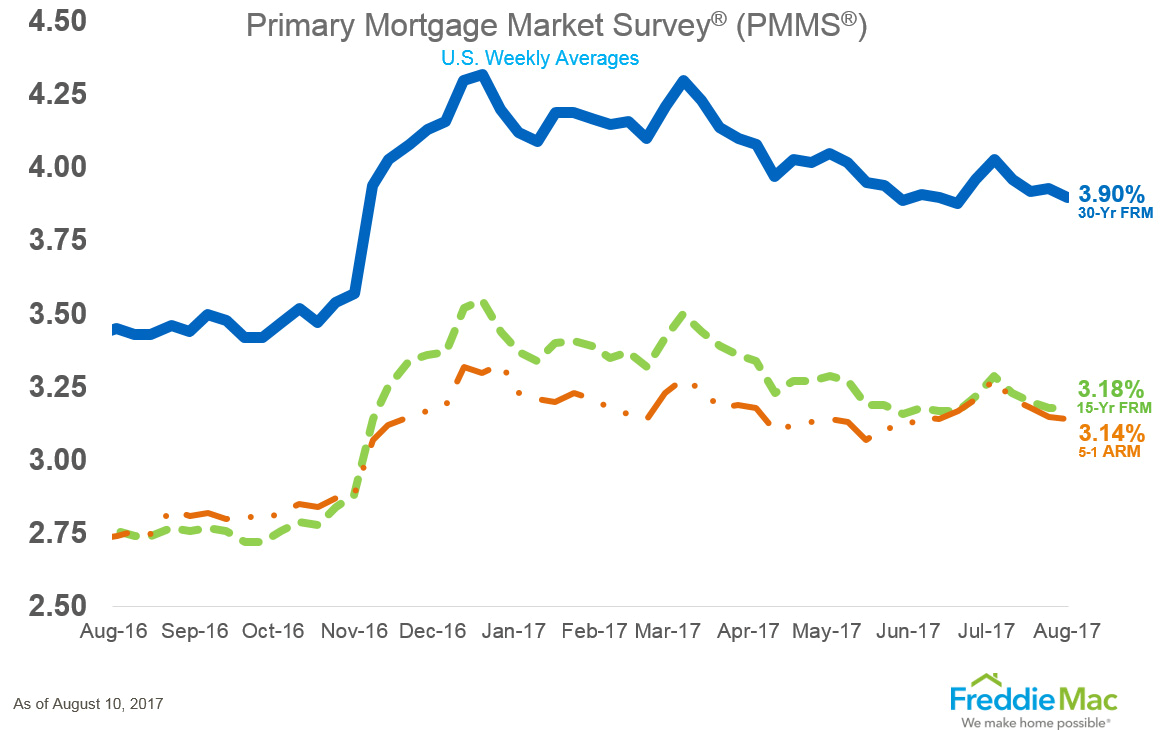
As can be seen from Freddie Mac’s Mortgage Market Survey, last week, 30 Yr. Fixed Mortgage rates for conforming loans hit 3.90% with the rate falling 0.03% basis points from the previous week.
Treasury Prices Rise and Yields Fall for U.S. 10 Yr. and 30 Yr. Treasuries.
At the Chicago Board of Trade (CBOT): the US 10 Year Treasury Note futures Contract for September settlement closed at a price of 126’18 / 32nds; the 10 Year Note was up 7 basis points (bps) on the day, yielding 2.1975%. The US 30 Year Treasury Bond futures Contract for Sept. settlement closed at a price of 155’11 / 32nds; the 30 Year Bond was up 20 basis points (bps) on the day, yielding 2.7729%. Mortgage Rates have come off their 2017 lows and are down 0.03% bps from the previous Freddie Mac Survey last week.
Thanks to ZeroHedge.com, Commerce Department, Bloomberg.com, and FreddieMac.com for Charts and Graphics.
ERATE's Daily Rate Summary
August 10, 2017
Mortgage Rates and Treasury Yields Fall.
On Wednesday, Treasury bond yields and Mortgage interest rates fell as Credit Market participants bet on volatility and interest rate moderation in ‘quiet’ period in August. The September 10 Yr. U.S. Treasury Note stood at a yield of 2.2476% and the 30 Yr. U.S. Treasury Bond is yielding 2.8222%. 30 Year Mortgages according to Freddie Mac were around 3.90% for conforming and 4.10% for Jumbo products.
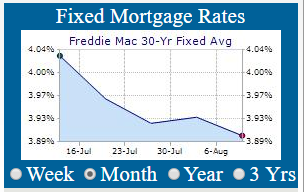
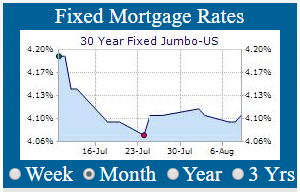
The Bond market continues to improve day by day and mortgage rates continue to improve slowly. The Credit Markets are in a lull before the Jackson Hole Symposium slated for August 21st to 24th. The key speaker of note will be Mario Draghi ECB President and he is expected to speak about the timetable for eventually tapering the ECB Corporate Bond Purchase program & tightening European credit conditions to reflect the EU recovery. Also, Janet Yellen Fed President should have words outlining the Fed’s plan to normalize their $4.5 Trillion Balance Sheet and path of Fed Funds Rate increases going forward and interest rates in general.
30 Year U.S. Treasury Bond Yield fall to 2.7972% then steadies at 2.8222%
(Chart courtesy of Zerohedge.com).
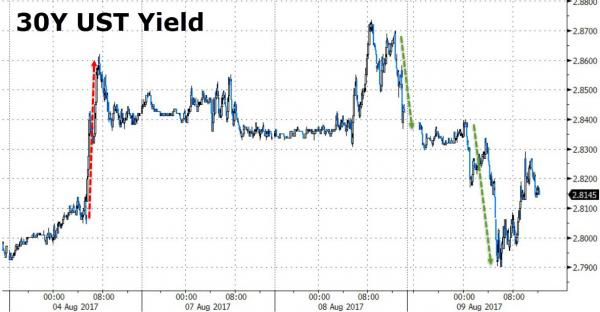
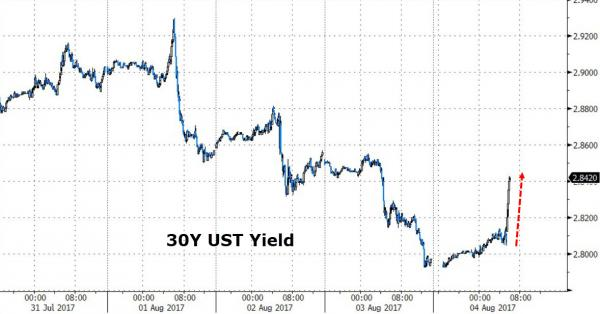
The 30 Year U.S. Treasury Bond is now expanded its trading range between 2.80% and 2.94%; as market participants try to guess whether we get a manufacturing recovery this summer or we dip back into recession in the real-goods producing sector of the economy.
30 Year U.S. Treasury Bond Yield Rangebound between 2.80% and 2.94%.
(Chart courtesy of Zerohedge.com).
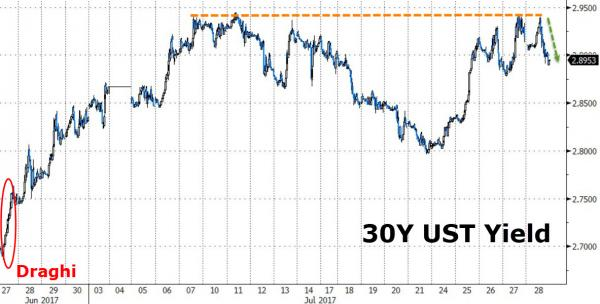
At the extremes of this range buyers of long bonds can be counted on to appears in force when the 30 Year U.S. Treasury Yield moves to the top of this range around 2.94%; conversely, sellers come out when the yield falls to 2.80%.
10 Year U.S. Treasury Note Yield Falls to 2.2212% then steadies at 2.2476%
(Chart courtesy of Zerohedge.com).
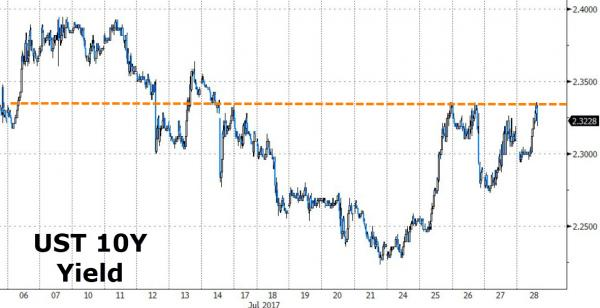
This gyration in bond yields looks like it wants to resolve itself by moving much lower into the gap that was formed post-election last November. If so, we will get another run at historically low rates before the final blow-off in Credit Markets sends Mortgage Interest rates up for good.
10 Year U.S. Treasury Note Yield Longer-term View back below 50-Day MA at 2.26%
(Chart courtesy of Zerohedge.com).
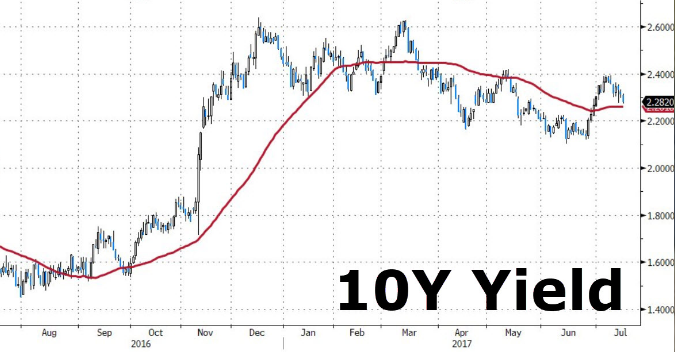
The above Chart does suggest that a constructive set-up is forming in the 10 Year Treasury Note with the potential to push the yield to around 2.00% over the next month. It is crucial that Mortgage Rates stay at or below 4.00% or demand for mortgage loans will dry up. The window of opportunity for borrowers seeking mortgage refinancing & home purchases is still open for now.
Weekly Mortgage Rates Analysis
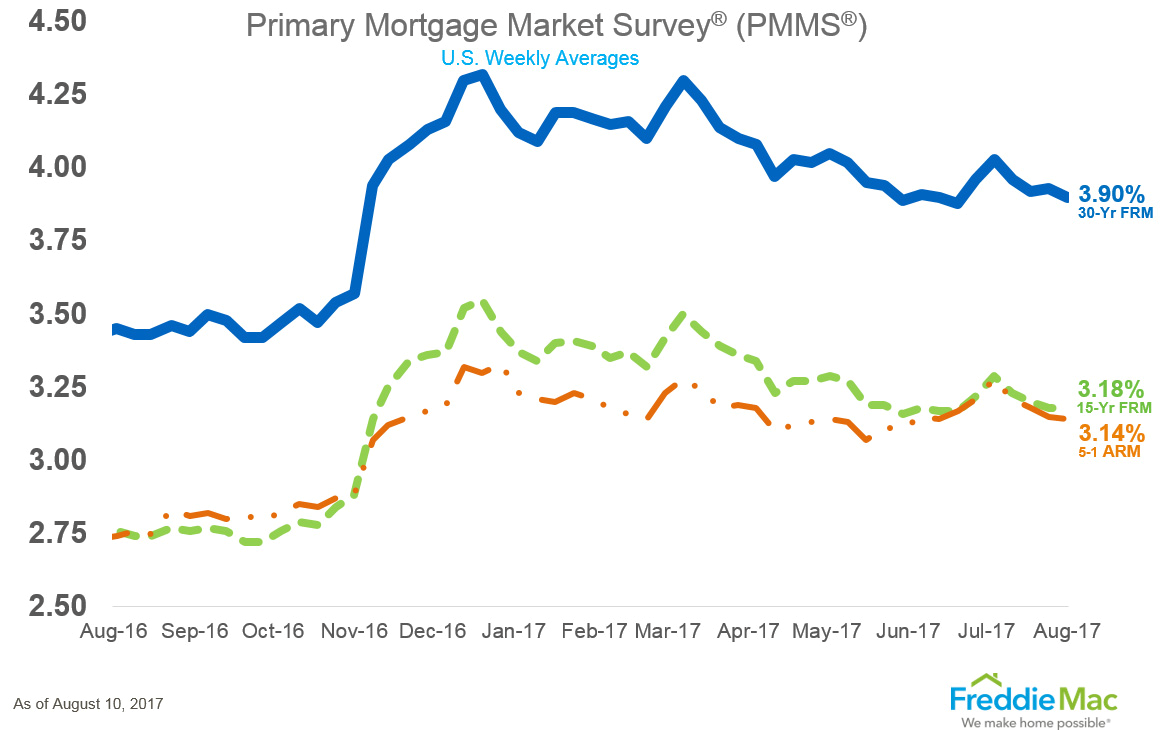
As can be seen from Freddie Mac’s Mortgage Market Survey, last week, 30 Yr. Fixed Mortgage rates for conforming loans hit 3.90% with the rate falling 0.03% basis points from the previous week.
Treasury Prices Rise and Yields Fall for U.S. 10 Yr. and 30 Yr. Treasuries.
At the Chicago Board of Trade (CBOT): the US 10 Year Treasury Note futures Contract for September settlement closed at a price of 126’11 / 32nds; the 10 Year Note was up 11 basis points (bps) on the day, yielding 2.2476%. The US 30 Year Treasury Bond futures Contract for Sept. settlement closed at a price of 154’23 / 32nds; the 30 Year Bond was up 32 basis points (bps) on the day, yielding 2.8222%. Mortgage Rates have come off their 2017 lows and are down 0.03% bps from the previous Freddie Mac Survey last week.
Thanks to ZeroHedge.com, Bureau of Labor Statistics, Bloomberg.com, and FreddieMac.com for Charts and Graphics.
ERATE's Daily Rate Summary
August 9, 2017
Mortgage Rates and Treasury Yields Rise.
On Tuesday, Treasury bond yields and Mortgage interest rates rose as Credit Market participants bet on volatility and interest rate moderation in ‘quiet’ period in August. The September 10 Yr. U.S. Treasury Note stood at a yield of 2.2619% and the 30 Yr. U.S. Treasury Bond is yielding 2.8428%. 30 Year Mortgages according to Freddie Mac were around 3.93% for conforming and 4.09% for Jumbo products.
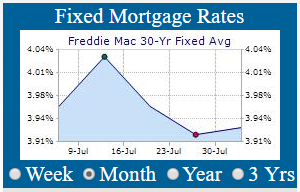
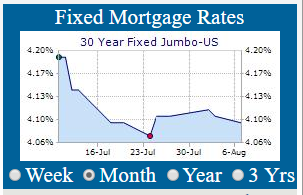
The Bond market continues to improve day by day and mortgage rates continue to improve slowly. The economy is not lifting off as anticipated (this is the seventh summer of recovery in a row) and I’m not buying it. The CB’s with all their talk, emergency measures, cheerleading, QE, ZIRP, and NIRP must have missed an important fundamental economic linkage in the monetary policy transmission mechanism; because at the base of it all folks are broke and cannot increase their spending with the income available to them. Inflation is not happening in an economy this mature and indebted, we are going to grind slowly down to a crawl and then stop. That’s when the fun begins!
30 Year U.S. Treasury Bond Yield fall to 2.7972% then steadies at 2.8428%
(Chart courtesy of Zerohedge.com).
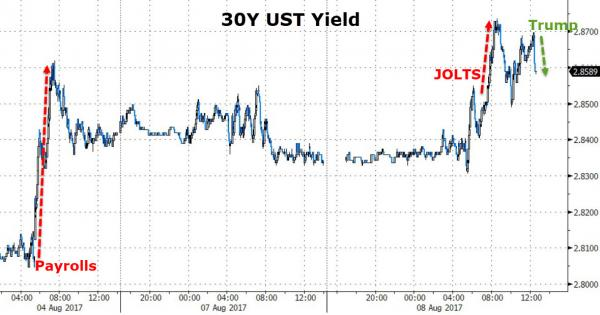
The 30 Year U.S. Treasury Bond is now expanded its trading range between 2.80% and 2.94%; as market participants try to guess whether we get a manufacturing recovery this summer or we dip back into recession in the real-goods producing sector of the economy.
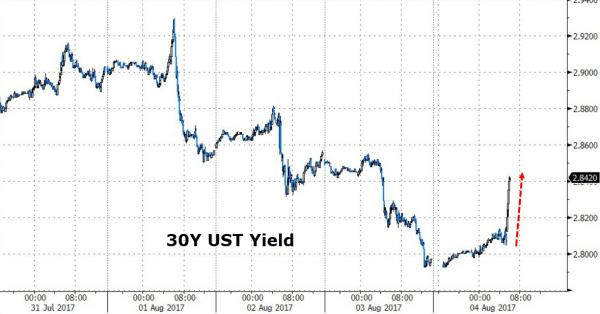
30 Year U.S. Treasury Bond Yield Rangebound between 2.80% and 2.94%.
(Chart courtesy of Zerohedge.com).
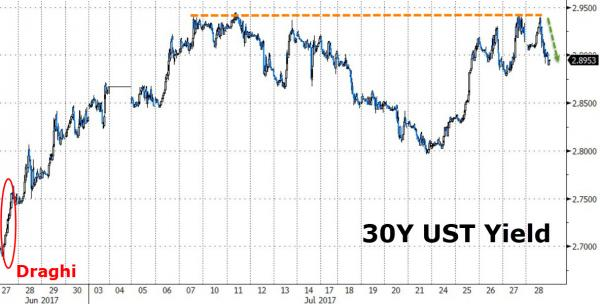
At the extremes of this range buyers of long bonds can be counted on to appears in force when the 30 Year U.S. Treasury Yield moves to the top of this range around 2.94%; conversely, sellers come out when the yield falls to 2.80%.
10 Year U.S. Treasury Note Yield Falls to 2.2212% then steadies at 2.2619%
(Chart courtesy of Zerohedge.com).
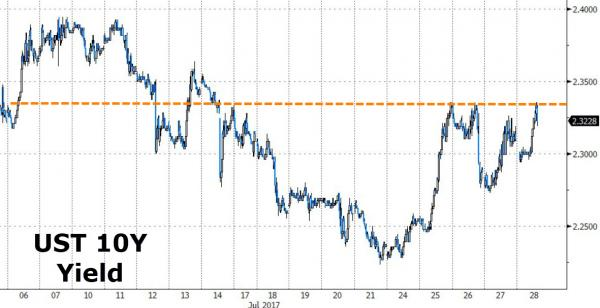
This gyration in bond yields looks like it wants to resolve itself by moving much lower into the gap that was formed post-election last November. If so, we will get another run at historically low rates before the final blow-off in Credit Markets sends Mortgage Interest rates up for good.
10 Year U.S. Treasury Note Yield Longer-term View back at 50-Day MA at 2.26%
(Chart courtesy of Zerohedge.com).
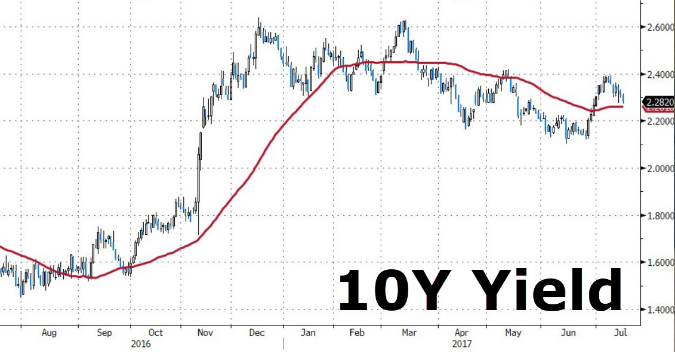
The above Chart does suggest that a constructive set-up is forming in the 10 Year Treasury Note with the potential to push the yield to around 2.00% over the next month. It is crucial that Mortgage Rates stay at or below 4.00% or demand for mortgage loans will dry up. The window of opportunity for borrowers seeking mortgage refinancing & home purchases is still open for now.
Weekly Mortgage Rates Analysis
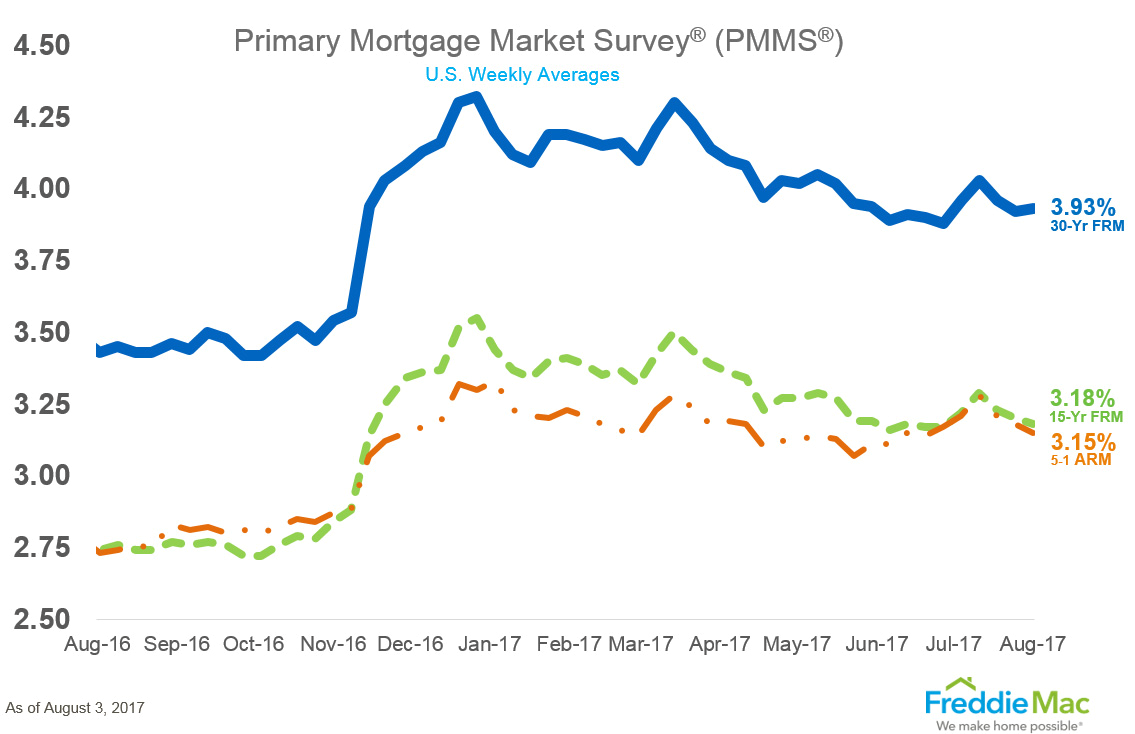
As can be seen from Freddie Mac’s Mortgage Market Survey, last week, 30 Yr. Fixed Mortgage rates for conforming loans hit 3.93% with the rate rising 0.01% basis points from the previous week.
Treasury Prices Fall and Yields Rise for U.S. 10 Yr. and 30 Yr. Treasuries.
At the Chicago Board of Trade (CBOT): the US 10 Year Treasury Note futures Contract for September settlement closed at a price of 126’00.5 / 32nds; the 10 Year Note was down 5 basis points (bps) on the day, yielding 2.2619%. The US 30 Year Treasury Bond futures Contract for Sept. settlement closed at a price of 153’23 / 32nds; the 30 Year Bond was down 19 basis points (bps) on the day, yielding 2.8428%. Mortgage Rates have come off their 2017 lows and are up 0.01% bps from the previous Freddie Mac Survey last week.
Thanks to ZeroHedge.com, Bureau of Labor Statistics, Bloomberg.com, and FreddieMac.com for Charts and Graphics.
ERATE's Daily Rate Summary
August 8, 2017
Mortgage Rates and Treasury Yields Fall.
On Monday, Treasury bond yields and Mortgage interest rates fell as Credit Market participants bet on volatility and interest rate moderation in ‘quiet’ period in August. The September 10 Yr. U.S. Treasury Note stood at a yield of 2.2530% and the 30 Yr. U.S. Treasury Bond is yielding 2.8336%. 30 Year Mortgages according to Freddie Mac were around 3.93% for conforming and 4.09% for Jumbo products.
We have been talking about jobs & employment a lot lately and why this recovery seems a bit different…The JOLTS report was just released by the Bureau of Labor Statistics (BLS) for June. “After nearly two years of being rangebound, between 5.5 and 6 million, the BLS's JOLTS report - Janet Yellen's favorite labor market indicator- showed that in June, the number of job openings soared by 461,000 from 5.7 million to a new all-time high of 6.163 million, smashing expectations of a far more subdued print of 5.75K, and resulting in a job openings rate of 4.0%, also tied for record high”, as articulated by Zerohedge.com in analyzing BLS report.
Total Nonfarm Job Openings Hits All-Time High of 6,136,000 in June
(Chart courtesy of Zerohedge.com).
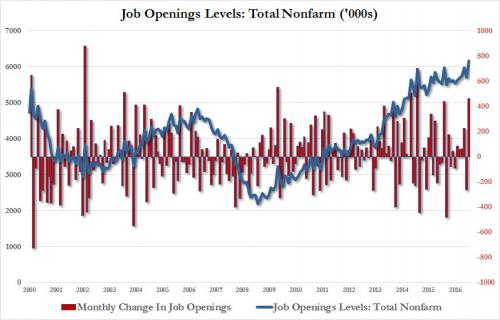
The biggest increase in job openings was in the Professional and Business Services category, which rose by 179K, Education and Health services which rose by 123K, Construction up by 62K, and Trade transportation up by 41K. Curiously, even manufacturing job openings increased by 38K in June, while Other Services and Retail job openings both declined, by 62K and 42K, respectively. The number of job openings increased in the Midwest and West regions.
Job Hires vs Change in Payrolls (‘000s) in June
(Chart courtesy of Zerohedge.com).
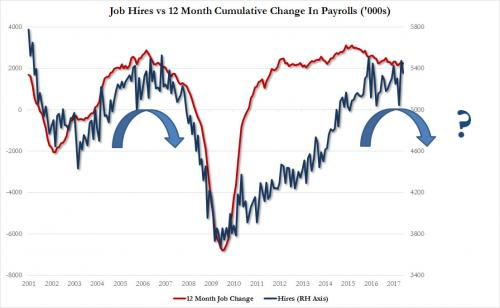
The data is extended and can be seen to flatten suggesting maturity and eventual decline. Aside from the unexpected surge in job openings, the rest of the report was more subdued, with the pace of hiring actually declining from 5.459MM to 5.356MM... With wage gains having yet to materialize.
30 Year U.S. Treasury Bond Yield fall to 2.7972% then steadies at 2.8336%
(Chart courtesy of Zerohedge.com).
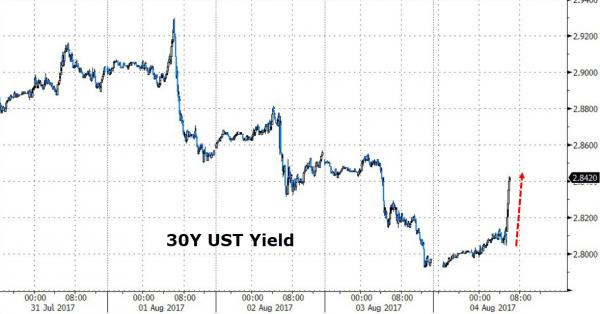
The 30 Year U.S. Treasury Bond is now expanded its trading range between 2.80% and 2.94%; as market participants try to guess whether we get a manufacturing recovery this summer or we dip back into recession in the real-goods producing sector of the economy.
30 Year U.S. Treasury Bond Yield Rangebound between 2.80% and 2.94%.
(Chart courtesy of Zerohedge.com).
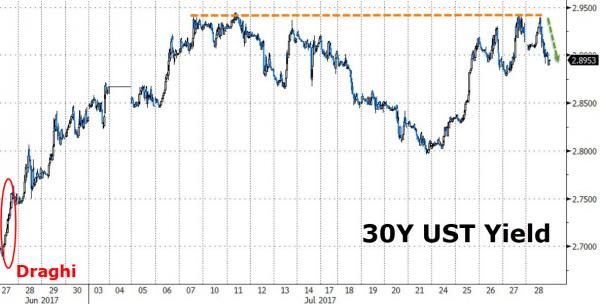
At the extremes of this range buyers of long bonds can be counted on to appears in force when the 30 Year U.S. Treasury Yield moves to the top of this range around 2.94%; conversely, sellers come out when the yield falls to 2.80%.
10 Year U.S. Treasury Note Yield Falls to 2.2212% then steadies at 2.2530%
(Chart courtesy of Zerohedge.com).
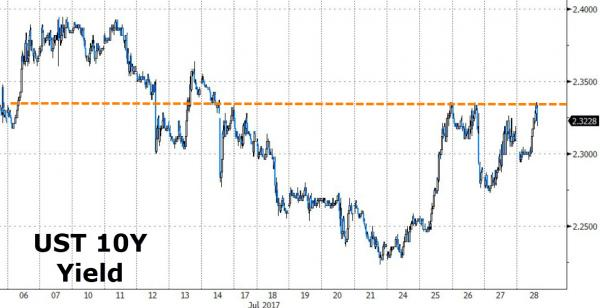
This gyration in bond yields looks like it wants to resolve itself by moving much lower into the gap that was formed post-election last November. If so, we will get another run at historically low rates before the final blow-off in Credit Markets sends Mortgage Interest rates up for good.
10 Year U.S. Treasury Note Yield Longer-term View back below 50-Day MA at 2.26%
(Chart courtesy of Zerohedge.com).
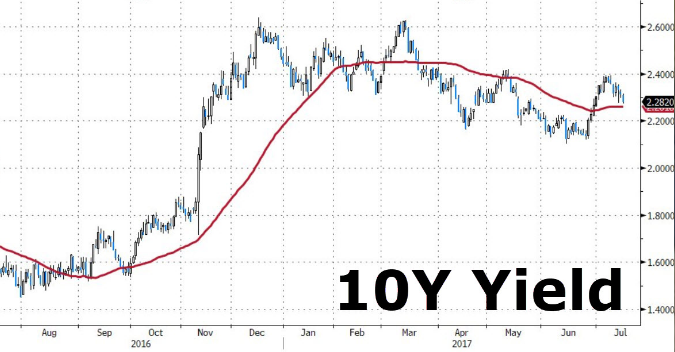
The above Chart does suggest that a constructive set-up is forming in the 10 Year Treasury Note with the potential to push the yield to around 2.00% over the next month. It is crucial that Mortgage Rates stay at or below 4.00% or demand for mortgage loans will dry up. The window of opportunity for borrowers seeking mortgage refinancing & home purchases is still open for now.
Weekly Mortgage Rates Analysis
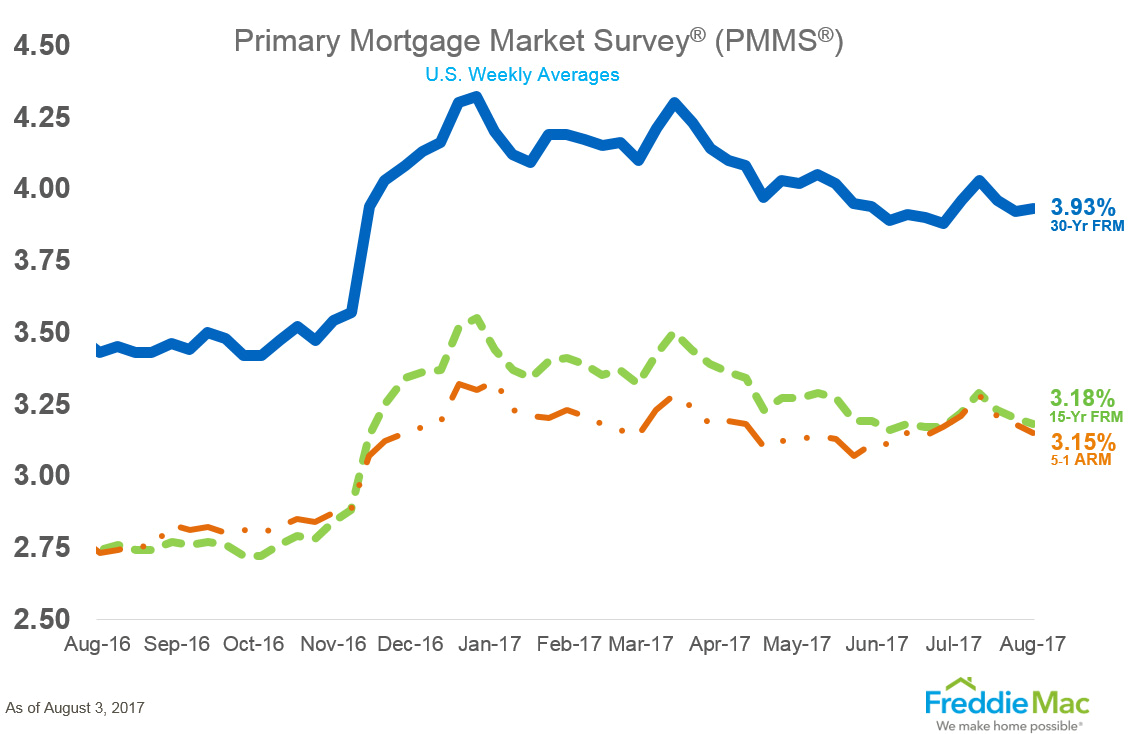
As can be seen from Freddie Mac’s Mortgage Market Survey, last week, 30 Yr. Fixed Mortgage rates for conforming loans hit 3.93% with the rate rising 0.01% basis points from the previous week.
Treasury Prices Rise and Yields Fall for U.S. 10 Yr. and 30 Yr. Treasuries.
At the Chicago Board of Trade (CBOT): the US 10 Year Treasury Note futures Contract for September settlement closed at a price of 126’05.5 / 32nds; the 10 Year Note was up 3 basis points (bps) on the day, yielding 2.2530%. The US 30 Year Treasury Bond futures Contract for Sept. settlement closed at a price of 154’10 / 32nds; the 30 Year Bond was up 7 basis points (bps) on the day, yielding 2.8336%. Mortgage Rates have come off their 2017 lows and are up 0.01% bps from the previous Freddie Mac Survey last week.
Thanks to ZeroHedge.com, Bureau of Labor Statistics, Bloomberg.com, and FreddieMac.com for Charts and Graphics.
ERATE's Daily Rate Summary
August 7, 2017
Mortgage Rates and Treasury Yields Rose.
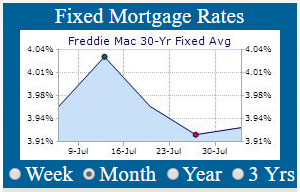
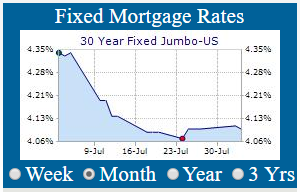
On Friday, Treasury bond yields and Mortgage interest rates rose as Credit Market participants bet on volatility and interest rate moderation in ‘quiet’ period in August. The September 10 Yr. U.S. Treasury Note stood at a yield of 2.2620% and the 30 Yr. U.S. Treasury Bond is yielding 2.8420%. 30 Year Mortgages according to Freddie Mac were around 3.93% for conforming and 4.10% for Jumbo products.
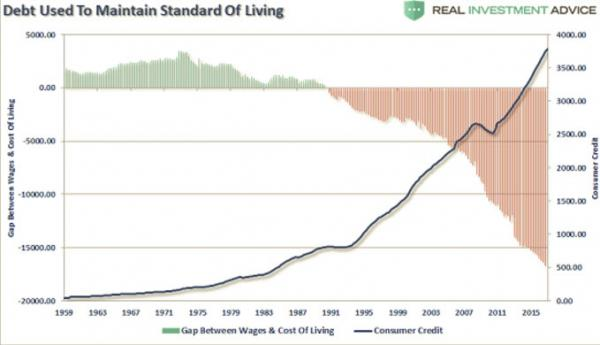
The Gap between Wages paid & Cost of Living has never been higher. The Chart below courtesy of Real Investment Advice show a very long historical view of this dynamic shortfall between Wages and the Cost of Living which has been mitigated over the years by reliance on Consumer Credit to fill the gap; which after a small jog in 2008-2009 is once again at record highs.
Debt Used To Maintain Standard of Living
(Chart courtesy of REAL Investment Advice).
It is widely known that both Thorstein Veblen and James Duesenberry recognized the significance of social influences on consumption patterns...
Average Weekly Earnings Rose 2.8% & Hourly Earnings Rose 2.5% in July
(Chart courtesy of Zerohedge.com).
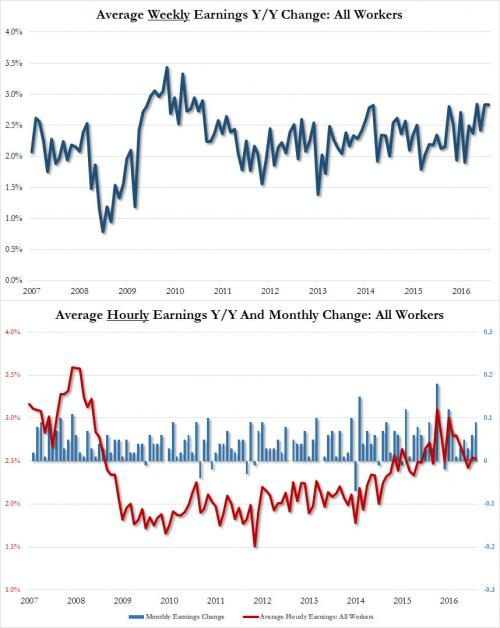
As can be seen by Monthly & Hourly Average Earning Charts consumer income growth from wages has been flat or in slow growth mode for the whole of this recovery. This creates what financial economists call the “Dusenberry Effect” which (as Zerohedge.com) basically states that consumers do not give up their consumption patterns very easy even if their incomes decline.
They, in effect, “ratchet” down their living standard very slowly by first having a second wage earner enter the workforce as we saw in the 1970’s when women began to enter the workforce en masse and then by taking on debt to finance their previous standard of living.
According to Zerohedge.com, “…[a] significant part of Duesenberry’s relative income hypothesis is that it suggests that when income of individuals or households falls, their consumption expenditure does not fall much. This is often called a ratchet effect. This is because, according to Duesenberry, the people try to maintain their consumption at the highest level attained earlier. This is partly due to the demonstration effect explained above. People do not want to show to their neighbors that they no longer afford to maintain their high standard of living.”
Further, this is also partly due to the fact that they become accustomed to their previous higher level of consumption and it is quite hard and difficult to reduce their consumption expenditure when their income has fallen. They maintain their earlier consumption level by reducing their savings. Therefore, the fall in their income, as during the period of recession or depression, does not result in decrease in consumption expenditure very much as one would conclude from family budget studies.
As Real Investment Advice opines, “We suspect the cumulative policy decisions of bailing out debt holders and punishing savers over the past 30 years has changed attitudes on debt accumulation.
30 Year U.S. Treasury Bond Yield fall to 2.7972% then rebounds to 2.8420% after NFP.
(Chart courtesy of Zerohedge.com).
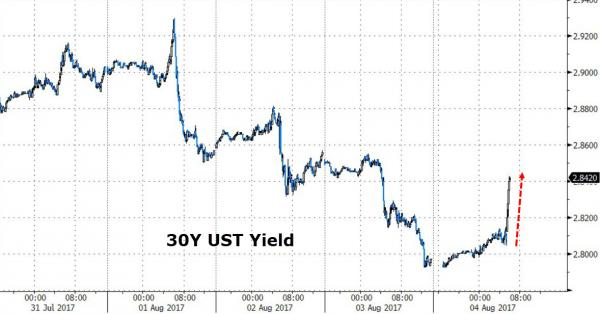
The 30 Year U.S. Treasury Bond is now expanded its trading range between 2.80% and 2.94%; as market participants try to guess whether we get a manufacturing recovery this summer or we dip back into recession in the real-goods producing sector of the economy.
30 Year U.S. Treasury Bond Yield Rangebound between 2.80% and 2.94%.
(Chart courtesy of Zerohedge.com).
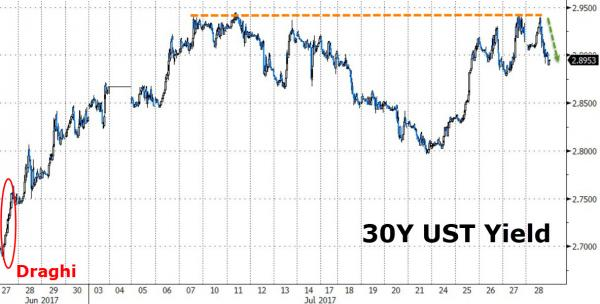
At the extremes of this range buyers of long bonds can be counted on to appears in force when the 30 Year U.S. Treasury Yield moves to the top of this range around 2.94%; conversely, sellers come out when the yield falls to 2.80%.
10 Year U.S. Treasury Note Yield Falls to 2.2212% then pops to 2.2620% on NFP
(Chart courtesy of Zerohedge.com).
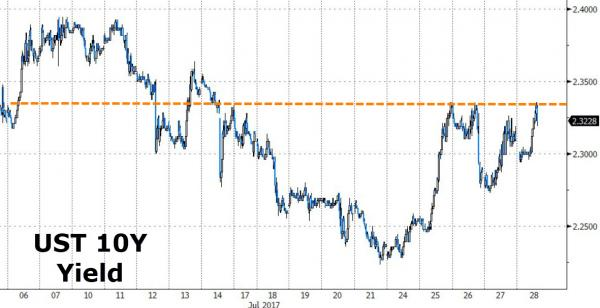
This gyration in bond yields looks like it wants to resolve itself by moving much lower into the gap that was formed post-election last November. If so, we will get another run at historically low rates before the final blow-off in Credit Markets sends Mortgage Interest rates up for good.
10 Year U.S. Treasury Note Yield Longer-term View back above 50-Day MA at 2.26%
(Chart courtesy of Zerohedge.com).
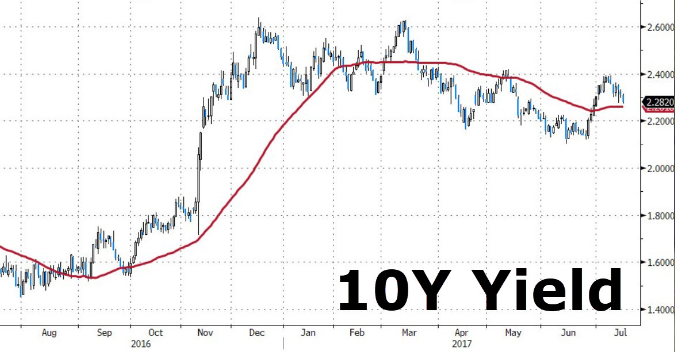
The above Chart does suggest that a constructive set-up is forming in the 10 Year Treasury Note with the potential to push the yield to around 2.00% over the next month. It is crucial that Mortgage Rates stay at or below 4.00% or demand for mortgage loans will dry up. The window of opportunity for borrowers seeking mortgage refinancing & home purchases is still open for now.
Weekly Mortgage Rates Analysis
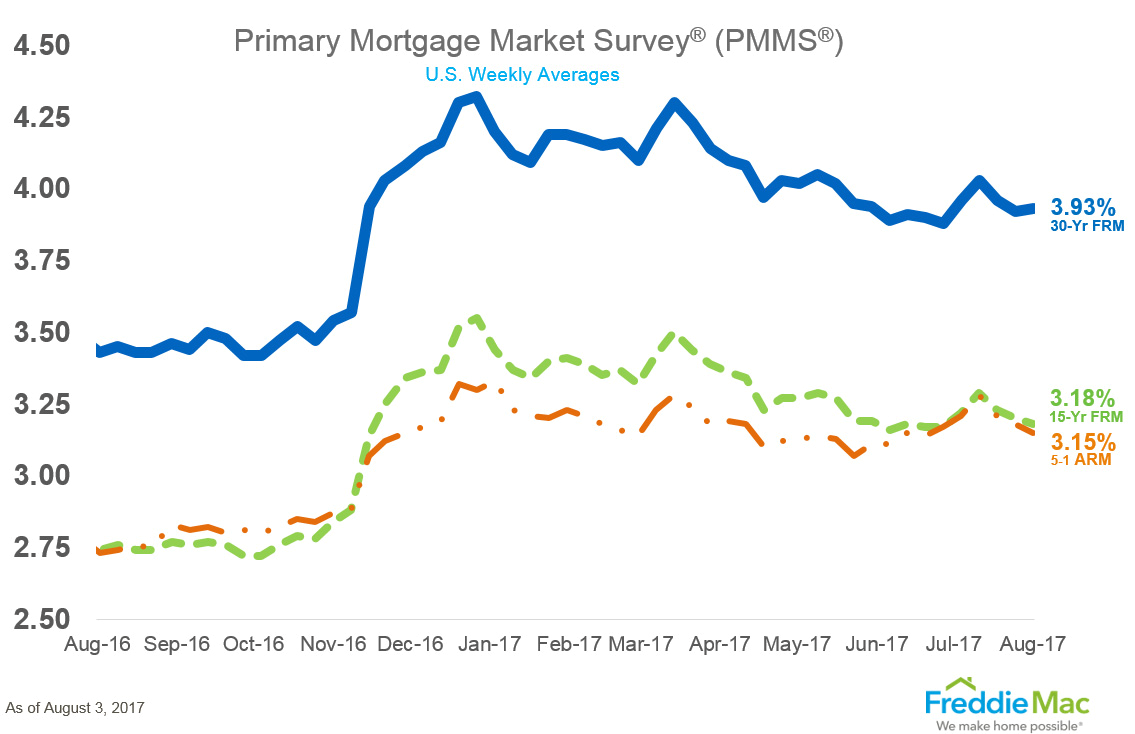
As can be seen from Freddie Mac’s Mortgage Market Survey, last week, 30 Yr. Fixed Mortgage rates for conforming loans hit 3.93% with the rate rising 0.01% basis points from the previous week.
Treasury Prices Fall and Yields Rise for U.S. 10 Yr. and 30 Yr. Treasuries.
At the Chicago Board of Trade (CBOT): the US 10 Year Treasury Note futures Contract for September settlement closed at a price of 126’02.5 / 32nds; the 10 Year Note was down 9 basis points (bps) on the day, yielding 2.2620%. The US 30 Year Treasury Bond futures Contract for Sept. settlement closed at a price of 154’03 / 32nds; the 30 Year Bond was down 29 basis points (bps) on the day, yielding 2.8420%. Mortgage Rates have come off their 2017 lows and are up 0.01% bps from the previous Freddie Mac Survey last week.
Thanks to ZeroHedge.com, Bloomberg.com, Real Investment Advice, and FreddieMac.com for Charts and Graphics.
ERATE's Daily Rate Summary
August 4, 2017
Mortgage Rates and Treasury Yields Fall.
On Thursday, Treasury bond yields and Mortgage interest rates fell sharply as Credit Market participants bet on volatility and interest rate moderation in 'quiet' period in August. The September 10 Yr. U.S. Treasury Note stood at a yield of 2.2212% and the 30 Yr. U.S. Treasury Bond is yielding 2.7972%. 30 Year Mortgages according to Freddie Mac were around 3.93% for conforming and 4.10% for Jumbo products.
The Bureau of Labor Statistics (BLS) reports that in July the US added 209K jobs, beating consensus expectations of a 180K print, while June was revised higher to 231K from 222K, even as May was revised modestly lower from 152K to 145K, for a net gain of +2,000 in the prior two months.
BLS Non-Farm Payroll increased +209,000 in July
(Chart courtesy of Zerohedge.com).
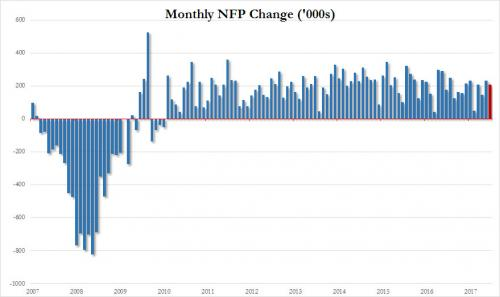
Nonfarm private payrolls rose 205k vs last month's 194k, and above the estimate of 180k, as the drop from durable manufacturing failed to materialize. In a familiar refrain, bars and restaurants hired the most workers of any sector in July.
Average Weekly Earnings Rose 2.8% & Hourly Earnings Rose 2.5% in July
(Chart courtesy of Zerohedge.com).
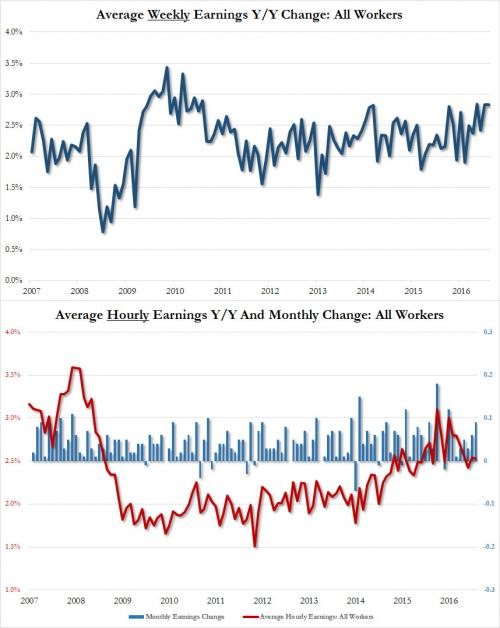
The BLS reported that Average Weekly & Hourly earnings both rose in July, which is consistent with the current narrative that Labor conditions are tightening and wages are finally beginning to see some inflationary pressure coming from the Labor Markets which we would expect from an economy which should now be in a strong recovery after 9 years.
Labor Force Participation Rate Rises to 62.9% Vs. People not In Labor Force totals 94 Million
(Chart courtesy of Zerohedge.com).
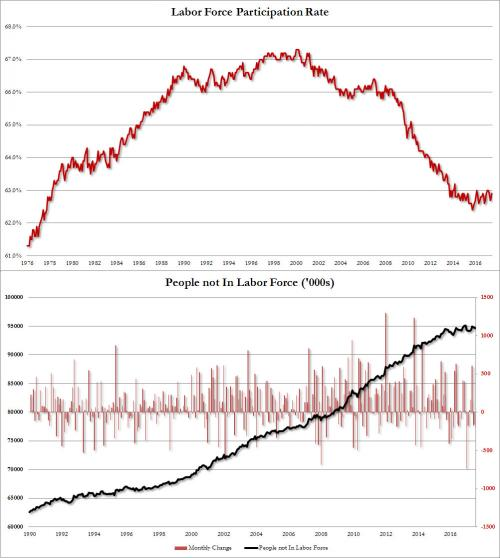
The unemployment rate dropped from 4.4% to 4.3% as expected, while the participation rate rose from 62.8% to 62.9%, as the number of workers out of the labor force declined by 156K to 94.657 million.
Total nonfarm payroll employment increased by 209,000 in July. Job gains occurred in food services and drinking places, professional and business services, and health care. Employment growth has averaged 184,000 per month thus far this year, in line with the average monthly gain in 2016 of (+187,000) jobs per month.
30 Year U.S. Treasury Bond Yield Falls to 2.7972% then rebounds to 2.8420% after NFP.
(Chart courtesy of Zerohedge.com).
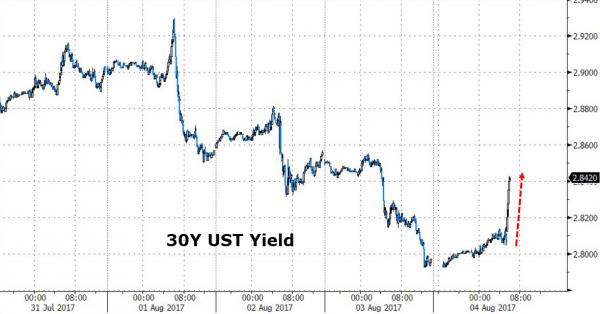
The 30 Year U.S. Treasury Bond is now expanded its trading range between 2.80% and 2.94%; as market participants try to guess whether we get a manufacturing recovery this summer or we dip back into recession in the real-goods producing sector of the economy.
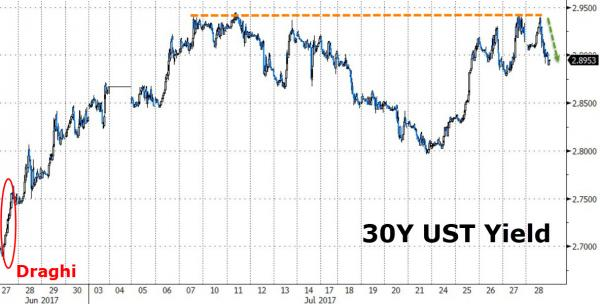
At the extremes of this range buyers of long bonds can be counted on to appears in force when the 30 Year U.S. Treasury Yield moves to the top of this range around 2.94%; conversely, sellers come out when the yield falls to 2.80%.
10 Year U.S. Treasury Note Yield Falls to 2.2212% then pops to 2.2869% on NFP
(Chart courtesy of Zerohedge.com).
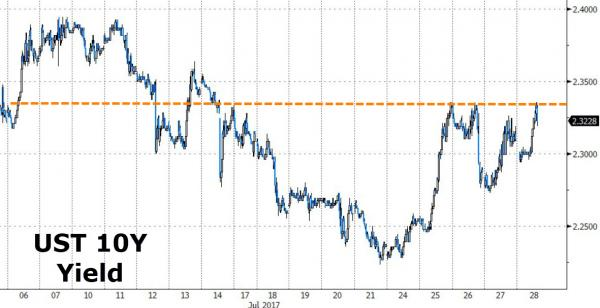
This gyration in bond yields looks like it wants to resolve itself by moving much lower into the gap that was formed post-election last November. If so, we will get another run at historically low rates before the final blow-off in Credit Markets sends Mortgage Interest rates up for good.
10 Year U.S. Treasury Note Yield Longer-term View back above 50-Day MA at 2.26%
(Chart courtesy of Zerohedge.com).
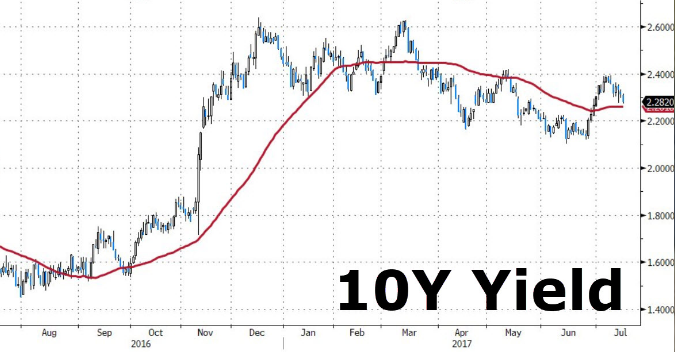
The above Chart does suggest that a constructive set-up is forming in the 10 Year Treasury Note with the potential to push the yield to around 2.00% over the next month. It is crucial that Mortgage Rates stay at or below 4.00% or demand for mortgage loans will dry up. The window of opportunity for borrowers seeking mortgage refinancing & home purchases is still open for now.
Weekly Mortgage Rates Analysis
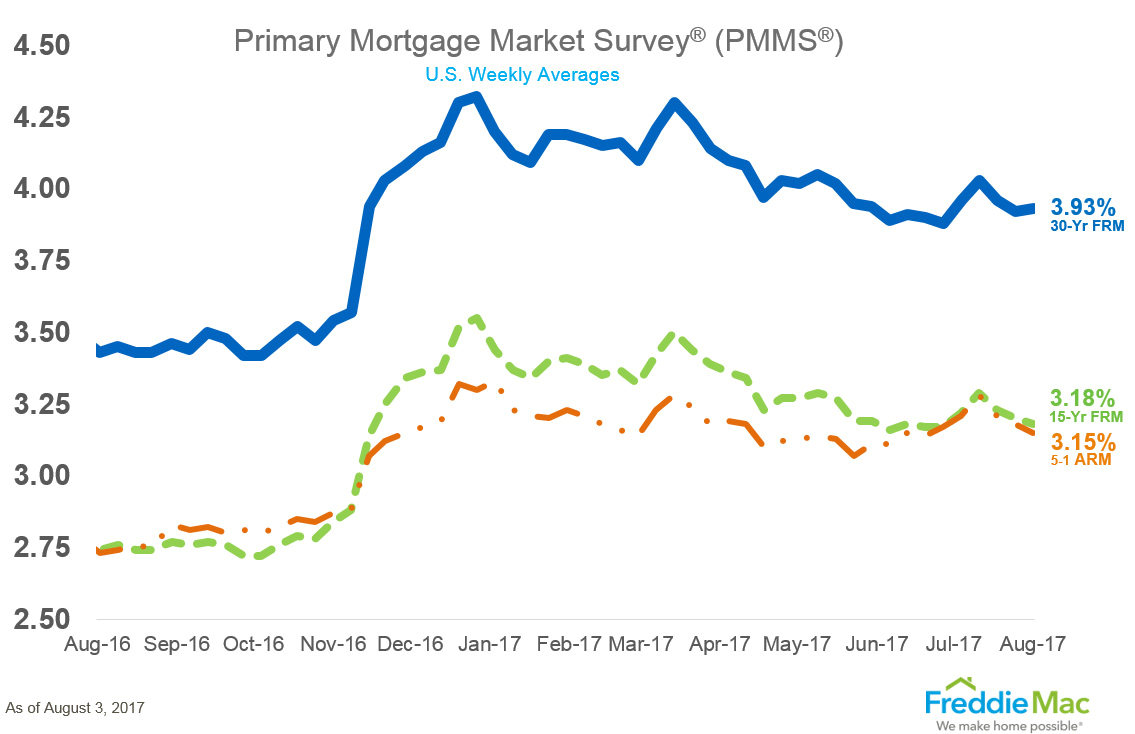
As can be seen from Freddie Mac's Mortgage Market Survey, last week, 30 Yr. Fixed Mortgage rates for conforming loans hit 3.93% with the rate rising 0.01% basis points from the previous week.
Treasury Prices Rise and Yields Fall for U.S. 10 Yr. and 30 Yr. Treasuries.
At the Chicago Board of Trade (CBOT): the US 10 Year Treasury Note futures Contract for September settlement closed at a price of 126'11.5 / 32nds; the 10 Year Note was up 8 basis points (bps) on the day, yielding 2.2212%. The US 30 Year Treasury Bond futures Contract for Sept. settlement closed at a price of 155'00 / 32nds; the 30 Year Bond was up 25 basis points (bps) on the day, yielding 2.7972%. Mortgage Rates have come off their 2017 lows and are up 0.01% bps from the previous Freddie Mac Survey last week.
Thanks to ZeroHedge.com, Bloomberg.com, Bureau of Labor Statistics, and FreddieMac.com for Charts and Graphics.
ERATE's Daily Rate Summary
August 3, 2017
Mortgage Rates and Treasury Yields Mixed.
On Wednesday, Treasury bond yields and Mortgage interest rates were mixed as Credit Market volatility increases and interest rates plumb lower reaches of the price range. The September 10 Yr. U.S. Treasury Note stood at a yield of 2.2710% and the 30 Yr. U.S. Treasury Bond is yielding 2.8559%. 30 Year Mortgages according to Freddie Mac were around 3.93% for conforming and 4.11% for Jumbo products.
The ISM Services Index fell sharply to a reading of 53.9 while the Services PMI rose to 54.7 in July; according to the Institute for Supply Management (ISM). Expectations were for a reading of 54.6 in the Services Index and 56.9 for the Services PMI.
ISM Services Index Falls to 53.9 & Services PMI Rises to 54.7 in July
(Chart courtesy of Zerohedge.com).
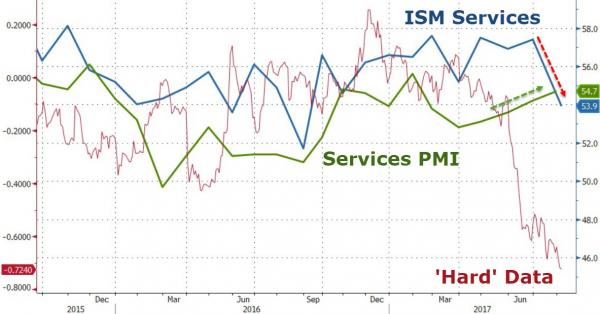
US Services were even more mixed with PMI printing at 6-month highs (new business expanding at its fastest in two years), and ISM collapsing to 11-month lows. In the context of the continuing collapse in 'hard' economic data (against even weaker expectations), Zerohedge.com noted; "surveys of US Services employers by PMI are ebullient, but it seems the people that ISM are talking to are dysphoric....and the 53.9 print below the lowest economist estimate of 54.9...missing expectations by 6 standard deviations...".
ISM Services Expectations Miss was a 6 Sigma Event
(Chart courtesy of Zerohedge.com).
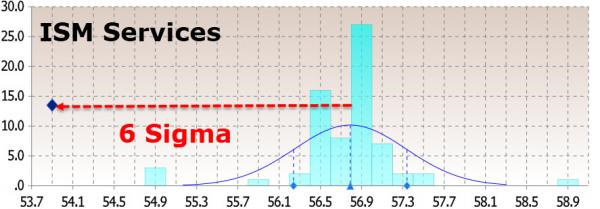
ISM Respondents do not seem to be as exuberant as PMI respondents.
"A typical and expected midsummer slowdown in hiring activity by employers is causing a normal slowdown in business for this time of year. We expect a sharp ramp-up of business activity over the next three months." (Management of Companies & Support Services)
"Business volume slowed some in June." (Health Care & Social Assistance)
"Business in third quarter is looking up, but it may be delayed from slower than expected second quarter. The next couple of months will determine the outcome." (Professional, Scientific & Technical Services)
There is one thing to pay attention to however: Input costs paid by service providers continued to rise in July, thereby extending the trend seen every month since data collection began in October 2009."
30 Year U.S. Treasury Bond Yield Falls to 2.8559%
(Chart courtesy of Zerohedge.com).
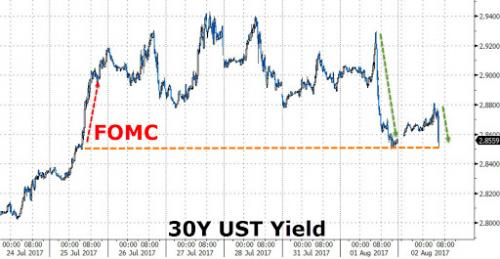
The 30 Year U.S. Treasury Bond is oscillating between 2.85% and 2.94%; as market participants try to guess whether we get a manufacturing recovery this summer or we dip back into recession in the real-goods producing sector of the economy.
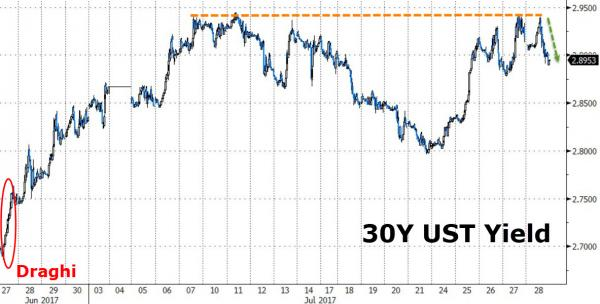
A buyer for long bonds always appears in force when the 30 Year U.S. Treasury Yield inches back up around the top of this range. Watch for Bond price volatility to increase sharply over the next several weeks as a tug-of-war between "Hawks" and "Doves" emerge in the quiet period between now and Jackson Hole, Wyoming conference, and the next Central Bank meetings in September.
10 Year U.S. Treasury Note Yield Rises to 2.2710%
(Chart courtesy of Zerohedge.com).
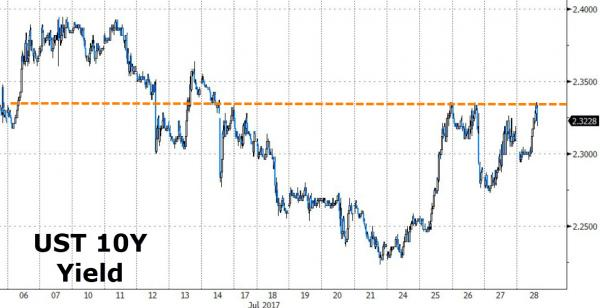
This gyration in bond yields looks like it wants to resolve itself by moving much lower into the gap that was formed post-election last November. If so, we will get another run at historically low rates before the final blow-off in Credit Markets sends Mortgage Interest rates up for good.
10 Year U.S. Treasury Note Yield Longer-term View back above 50-Day MA at 2.26%
(Chart courtesy of Zerohedge.com).
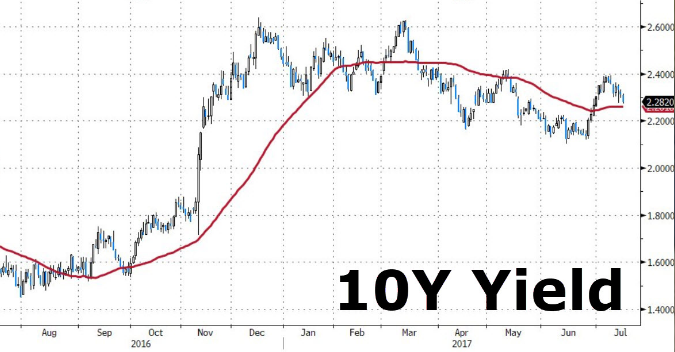
The above Chart does suggest that a constructive set-up is forming in the 10 Year Treasury Note with the potential to push the yield to around 2.00% over the next month. It is crucial that Mortgage Rates stay at or below 4.00% or demand for mortgage loans will dry up. The window of opportunity for borrowers seeking mortgage refinancing & home purchases is still open for now.
Weekly Mortgage Rates Analysis
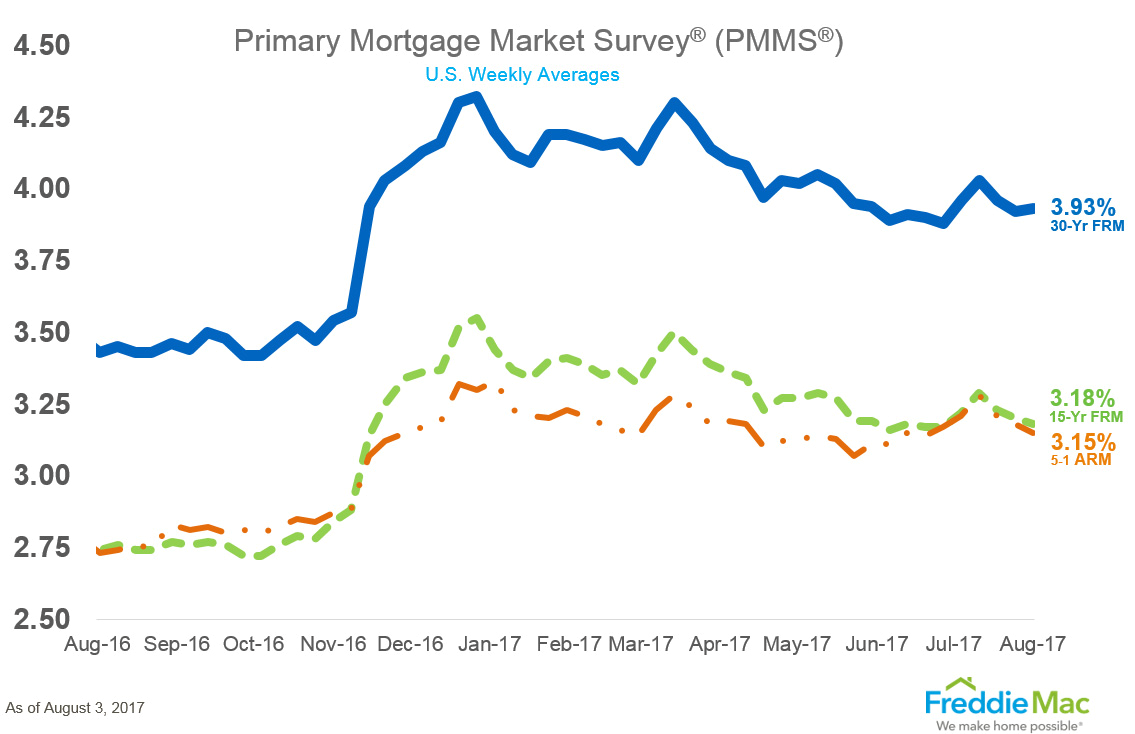
As can be seen from Freddie Mac's Mortgage Market Survey, last week, 30 Yr. Fixed Mortgage rates for conforming loans hit 3.93% with the rate rising 0.01% basis points from the previous week.
Treasury Prices Fall and Yields Rise Slightly for U.S. 10 Yr. and 30 Yr. Treasuries.
At the Chicago Board of Trade (CBOT): the US 10 Year Treasury Note futures Contract for September settlement closed at a price of 126'03.5 / 32nds; the 10 Year Note was down 4 basis points (bps) on the day, yielding 2.2710%. The US 30 Year Treasury Bond futures Contract for Sept. settlement closed at a price of 154'07 / 32nds; the 30 Year Bond was up 6 basis points (bps) on the day, yielding 2.8559%. Mortgage Rates have come off their 2017 lows and are down 0.04% bps from the previous Freddie Mac Survey last week.
Thanks to ZeroHedge.com, Bloomberg.com, Institute for Supply Management, and FreddieMac.com for Charts and Graphics.
ERATE's Daily Rate Summary
August 2, 2017
Mortgage Rates and Treasury Yields Fall.
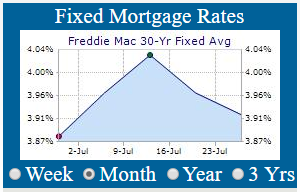
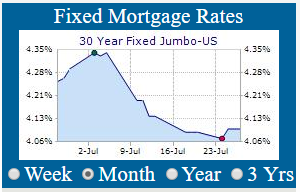
On Tuesday, Treasury bond yields and Mortgage interest rates fell moderately as Credit Market volatility increases and interest rates plumb lower reaches of the price range. The September 10 Yr. U.S. Treasury Note stood at a yield of 2.2532% and the 30 Yr. U.S. Treasury Bond is yielding 2.8567%. 30 Year Mortgages according to Freddie Mac were around 3.92% for conforming and 4.10% for Jumbo products.
In July, the ADP Payrolls Employment Survey for July increased by 178,000 jobs. While the ADP Manufacturing Employment Index was flat losing -4,000 jobs. Service Jobs added the bulk of those gains in employment in July adding 174,000 while Goods Producing had a +4,000 gain in jobs. On a total employment change basis this was the second worst month since October:
ADP Payroll Employment Survey Gains +178,000 Jobs in July
(Sources: ADP, LLC; Moody's Analytics).
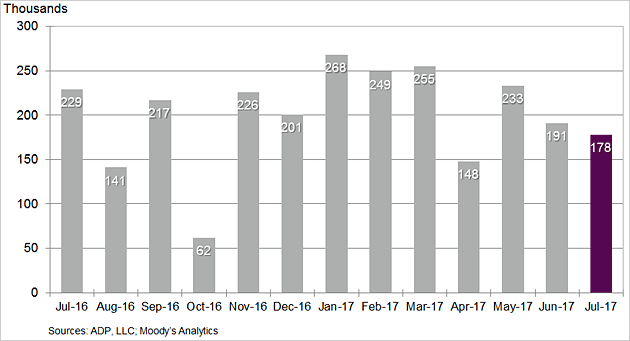
Two months in a row, ADP has weakened as ISM surveys suggested employment is rolling over. After April and June's disappointment, ADP reports the US economy added 178k jobs in July (less than the 190k expectation and below June's upwardly revised 191k). This is somewhat in line with the 180k expectation for NFP on Friday.
ADP Manufacturing Employment Flat
(Chart courtesy of Zerohedge.com).
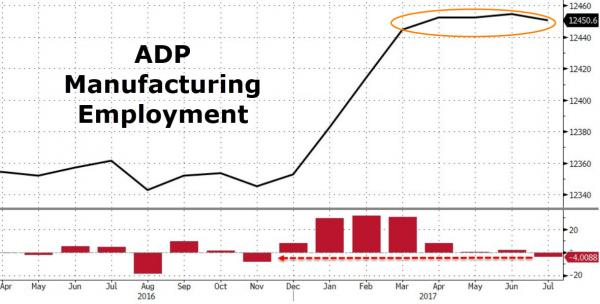
From a longer-term perspective, after 3 months of adding manufacturing jobs the economy has taken a breather in Manufacturing Employment since March according to ADP Survey. "Job gains continued to be strong in the month of July," said Ahu Yildirmaz, vice president and co-head of the ADP Research Institute. "However, as the labor market tightens employers may find it more difficult to recruit qualified workers."
Mark Zandi, chief economist of Moody's Analytics, said, "The American job machine continues to operate in high gear. Job gains are broad-based across industries and company sizes, with only manufacturers reducing their payrolls. At this pace of job growth, unemployment will continue to quickly decline."
30 Year U.S. Treasury Bond Yield Falls to 2.8559%
(Chart courtesy of Zerohedge.com).
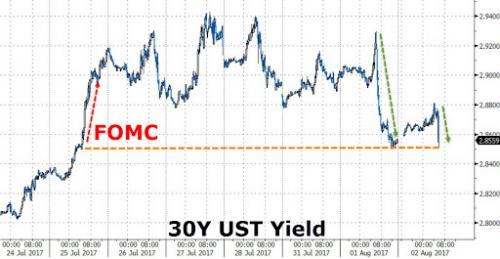
The 30 Year U.S. Treasury Bond is oscillating between 2.85% and 2.94%; as market participants try to guess whether we get a manufacturing recovery this summer or we dip back into recession in the real-goods producing sector of the economy.
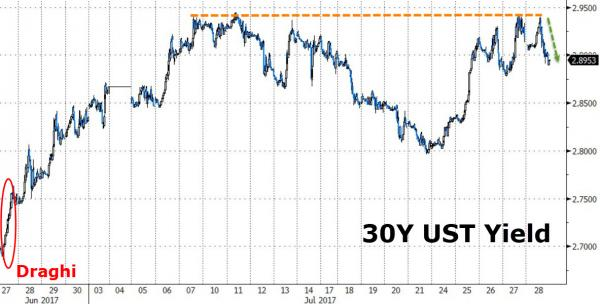
A buyer for long bonds always appears in force when the 30 Year U.S. Treasury Yield inches back up around the top of this range. Watch for Bond price volatility to increase sharply over the next several weeks as a tug-of-war between "Hawks" and "Doves" emerge in the quiet period between now and Jackson Hole, Wyoming conference, and the next Central Bank meetings in September.
10 Year U.S. Treasury Note Yield Falls to 2.2532%
(Chart courtesy of Zerohedge.com).
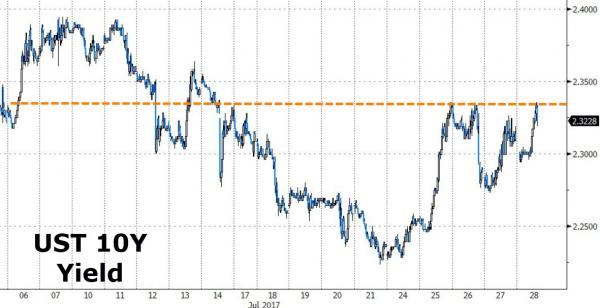
This gyration in bond yields looks like it wants to resolve itself by moving much lower into the gap that was formed post-election last November. If so, we will get another run at historically low rates before the final blow-off in Credit Markets sends Mortgage Interest rates up for good.
10 Year U.S. Treasury Note Yield Longer-term View back below 50-Day MA at 2.26%
(Chart courtesy of Zerohedge.com).
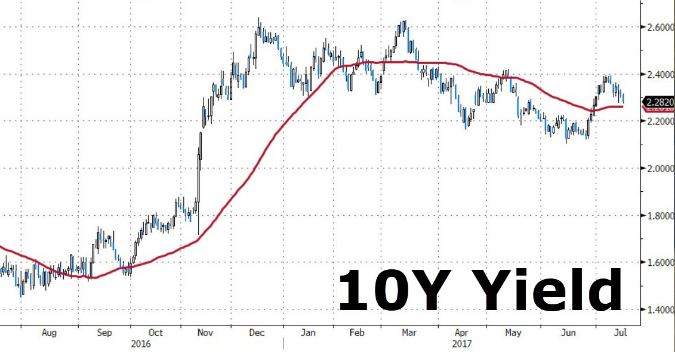
The above Chart does suggest that a constructive set-up is forming in the 10 Year Treasury Note with the potential to push the yield to around 2.00% over the next month. It is crucial that Mortgage Rates stay at or below 4.00% or demand for mortgage loans will dry up. The window of opportunity for borrowers seeking mortgage refinancing & home purchases is still open for now.
Weekly Mortgage Rates Analysis
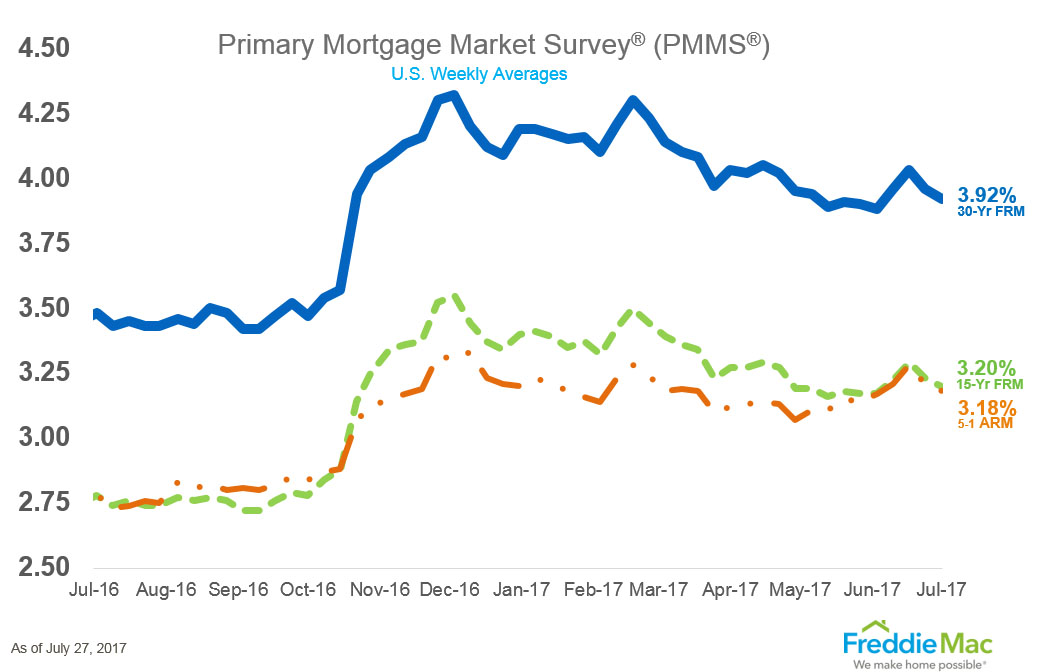
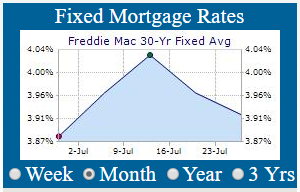
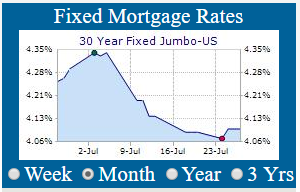
As can be seen from Freddie Mac's Mortgage Market Survey, last week, 30 Yr. Fixed Mortgage rates for conforming loans hit 3.92% with the rate falling 0.04% basis points from the previous week.
Treasury Prices Rise and Yields Fall Moderately for U.S. 10 Yr. and 30 Yr. Treasuries.
At the Chicago Board of Trade (CBOT): the US 10 Year Treasury Note futures Contract for September settlement closed at a price of 126'07.5 / 32nds; the 10 Year Note was up 11 basis points (bps) on the day, yielding 2.2532%. The US 30 Year Treasury Bond futures Contract for Sept. settlement closed at a price of 154'02 / 32nds; the 30 Year Bond was up 34 basis points (bps) on the day, yielding 2.8567%. Mortgage Rates have come off their 2017 lows and are down 0.04% bps from the previous Freddie Mac Survey last week.
Thanks to ZeroHedge.com, ADP, LLC; Moody's Analytics, and FreddieMac.com for Charts and Graphics.
ERATE's Daily Rate Summary
August 1, 2017
Mortgage Rates and Treasury Yields Rose Slightly.
On Monday, Treasury bond yields and Mortgage interest rates rose slightly as Credit Markets volatility increase and interest rates search around seeking direction. The September 10 Yr. U.S. Treasury Note stood at a yield of 2.2942% and the 30 Yr. U.S. Treasury Bond is yielding 2.8999%. 30 Year Mortgages according to Freddie Mac were around 3.92% for conforming and 4.10% for Jumbo products.
In July, ISM Manufacturing Index fell to 56.3, while the Manufacturing PMI rose to 53.3 in a mixed bag of reports about the U.S. Manufacturing economy. The U.S. Macro 'Hard' Data picture remains where it has been all spring in the dumps with depressed overall conditions.
ISM Manufacturing, PMI Index, Vs. U.S. Macro 'Hard' Data
(Chart courtesy of Zerohedge.com).
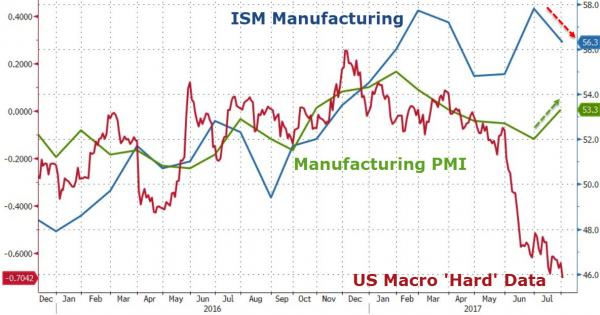
From a longer-term perspective, economic conditions based on 'Hard' Data and not 'Soft' data surveys asking about buoyant outlook & perspectives as Stocks continue to hit all-time highs; has led to a dichotomy of historic proportions regarding future expectations. After hitting a 9-month low in June, Markit's US Manufacturing PMI bounced to 53.3 in July with new orders, output, and employment rebounding. In a China-like moment, ISM disappointed, modestly dropping to 56.3 with prices paid surging and new orders tumbling. All of this uncertainty is happening as 'hard' data in the American economy is collapsing. After six straight months lower, PMI bounced in July (very slightly beating the 53.2 expectation) but ISM dipped and missed expectations.
U.S. Treasury Bond Yield Rises to 2.8999%
(Chart courtesy of Zerohedge.com).
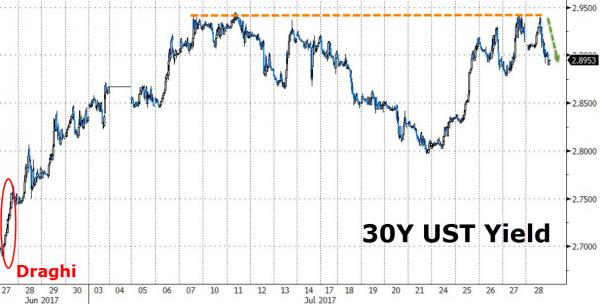
The 30 Year U.S. Treasury Bond is oscillating between 2.88% and 2.94%; as market participants try to guess whether we get a manufacturing recovery this summer or we dip back into recession in the real-goods producing sector of the economy. A buyer for long bonds always appears in force when the 30 Year U.S. Treasury Yield inches back up around the top of this range. Watch for Bond price volatility to increase sharply over the next several weeks as a tug-of-war between "Hawks" and "Doves" emerge in the quiet period between now the next Central Bank meetings in September.
10 Year U.S. Treasury Note Yield Falls to 2.2942%
(Chart courtesy of Zerohedge.com).
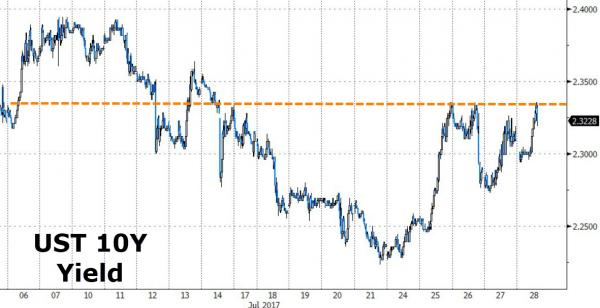
This gyration in bond yields looks like it wants to resolve itself by moving much lower into the gap that was formed post-election last November. If so, we will get another run at historically low rates before the final blow-off in Credit Markets sends Mortgage Interest rates up for good.
10 Year U.S. Treasury Note Yield Longer-term View back above 50-Day MA at 2.26%
(Chart courtesy of Zerohedge.com).
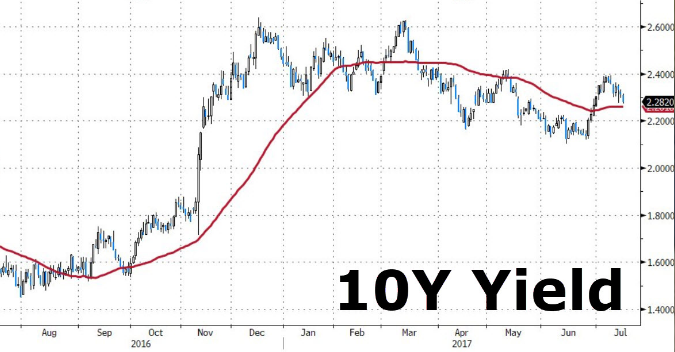
The above Chart does suggest that a constructive set-up is forming in the 10 Year Treasury Note with the potential to push the yield to around 2.00% over the next month. As Congress turns its attention to negotiations regarding the raising of the Debt-Ceiling and U.S. Government finances once again. It is crucial that Mortgage Rates stay at or below 4.00% or demand for mortgage loans will dry up. The window of opportunity for borrowers seeking mortgage refinancing & home purchases is still open for now, but for how long?
Weekly Mortgage Rates Analysis
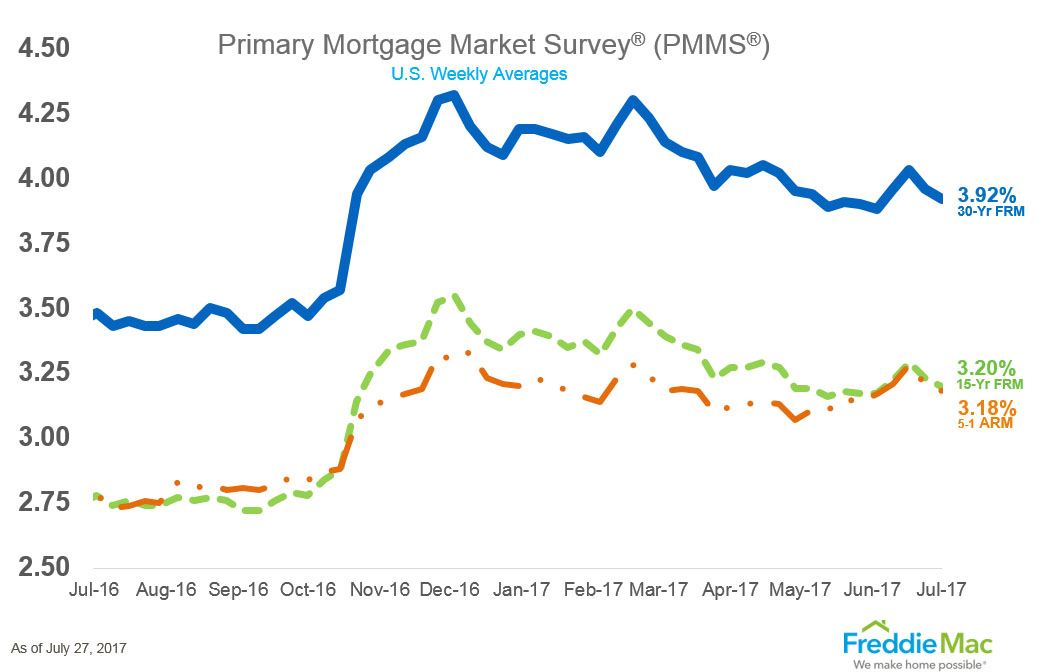
As can be seen from Freddie Mac's Mortgage Market Survey, last week, 30 Yr. Fixed Mortgage rates for conforming loans hit 3.92% with the rate falling 0.04% basis points from the previous week.
Treasury Prices Rise and Yields Rise Slightly for U.S. 10 Yr. and 30 Yr. Treasuries.
At the Chicago Board of Trade (CBOT): the US 10 Year Treasury Note futures Contract for September settlement closed at a price of 125'28.5 / 32nds; the 10 Year Note was down 2 basis points (bps) on the day, yielding 2.2942%. The US 30 Year Treasury Bond futures Contract for Sept. settlement closed at a price of 152'31 / 32nds; the 30 Year Bond was down 7 basis points (bps) on the day, yielding 2.8999%. Mortgage Rates have come off their 2017 lows and are down 0.04% bps from the previous Freddie Mac Survey last week.
Thanks to ZeroHedge.com, Markit.com, and FreddieMac.com for Charts and Graphics.
ERATE's Daily Rate Summary
July 31, 2017
Mortgage Rates and Treasury Yields Fell Slightly.
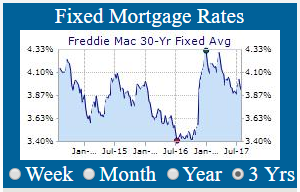
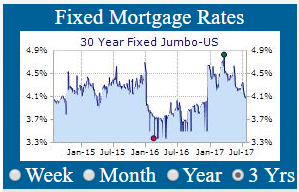
On Friday, Treasury bond yields and Mortgage interest rates fell slightly as Credit Markets volatility increase and interest rates search around seeking direction. The September 10 Yr. U.S. Treasury Note stood at a yield of 2.2889% and the 30 Yr. U.S. Treasury Bond is yielding 2.8953%. 30 Year Mortgages according to Freddie Mac were around 3.92% for conforming and 4.10% for Jumbo products.
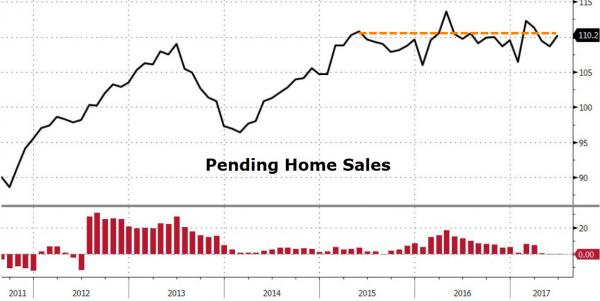
In June, Pending Home Sales Rose 1.5% (MoM) from the previous month.
Pending Home Sales MoM Rise 1.5%
(Chart courtesy of Zerohedge.com).
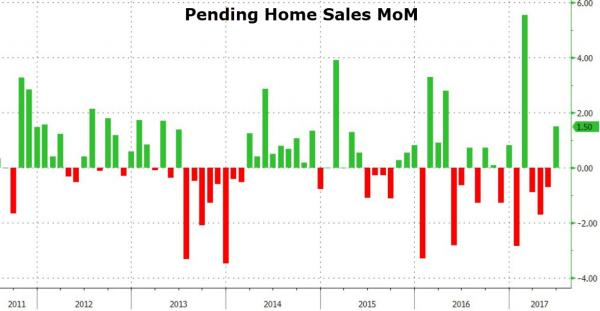
From a longer-term perspective, Pending Home Sales have increased just 0.7% year-over-year and the index is up to 110.2 in the past six years.
Market conditions in many areas continue to be fast paced, with few properties to choose from, which is forcing buyers to act almost immediately on an available home that fits their criteria," Lawrence Yun, NAR's chief economist, said in a statement.
"Low supply is an ongoing issue holding back activity. Housing inventory declined last month and is a staggering 7.1 percent lower than a year ago."
Two things do stand out though: 13 percent of sales went to investors, smallest share this year; and All-cash transactions accounted for 18 percent of signings, the smallest share since June 2009.
Pending Home Sales Historical View (2011 to Present) +10.2%
(Chart courtesy of Zerohedge.com).
30 Year U.S. Treasury Bond Yield Falls to 2.8953%
(Chart courtesy of Zerohedge.com).
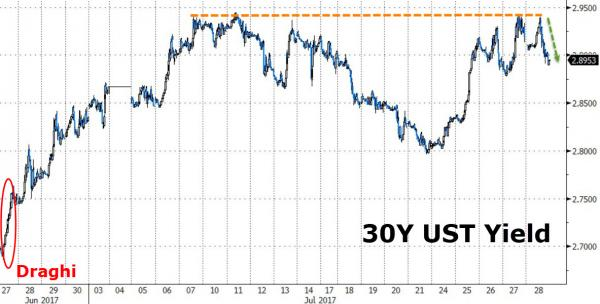
The 30 Year U.S. Treasury Bond is being whipsawed back-and-forth as successive Central Bank speakers take turns sounding-off on the near-term course of interest rate policy. Watch for Bond price volatility to increase sharply over the next several weeks as a tug-of-war between "Hawks" and "Doves" emerge in the quiet period between now the next Central Bank meetings in September.
10 Year U.S. Treasury Note Yield Rises to 2.3228%
(Chart courtesy of Zerohedge.com).
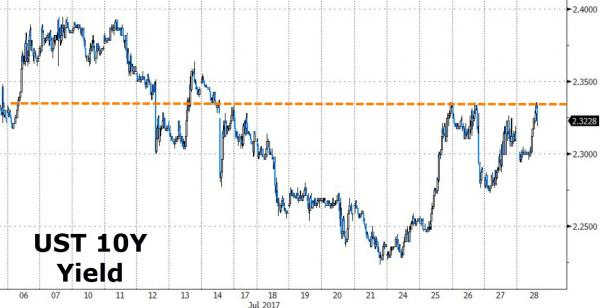
This gyration in yields is most unwelcome and will put a damper on the summer homebuying season which was already one of the weakest in recent years due to lack of supply & affordability according to Larry Yun chief economist at the National Association of Realtors (NAR).
10 Year U.S. Treasury Note Yield Longer-term View back above 50-Day MA at 2.26%
(Chart courtesy of Zerohedge.com).
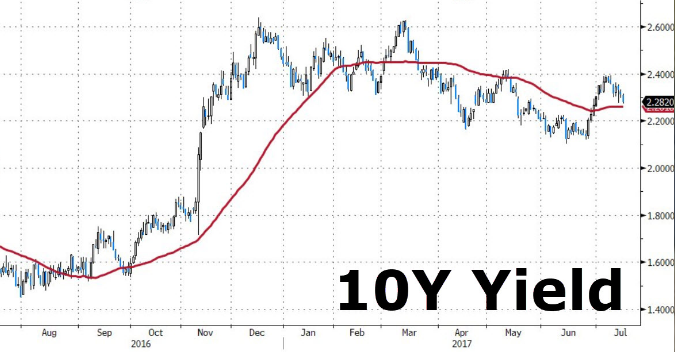
The above Chart does suggest that a constructive set-up is forming in the 10 Year Treasury Note with the potential to push the yield to around 2.00% over the next month. As Congress turns its attention to negotiations regarding the raising of the Debt-Ceiling and U.S. Government finances once again. It is crucial that Mortgage Rates stay at or below 4.00% or demand for mortgage loans will dry up. The window of opportunity for borrowers seeking mortgage refinancing & home purchases is still open for now, but for how long?
Weekly Mortgage Rates Analysis
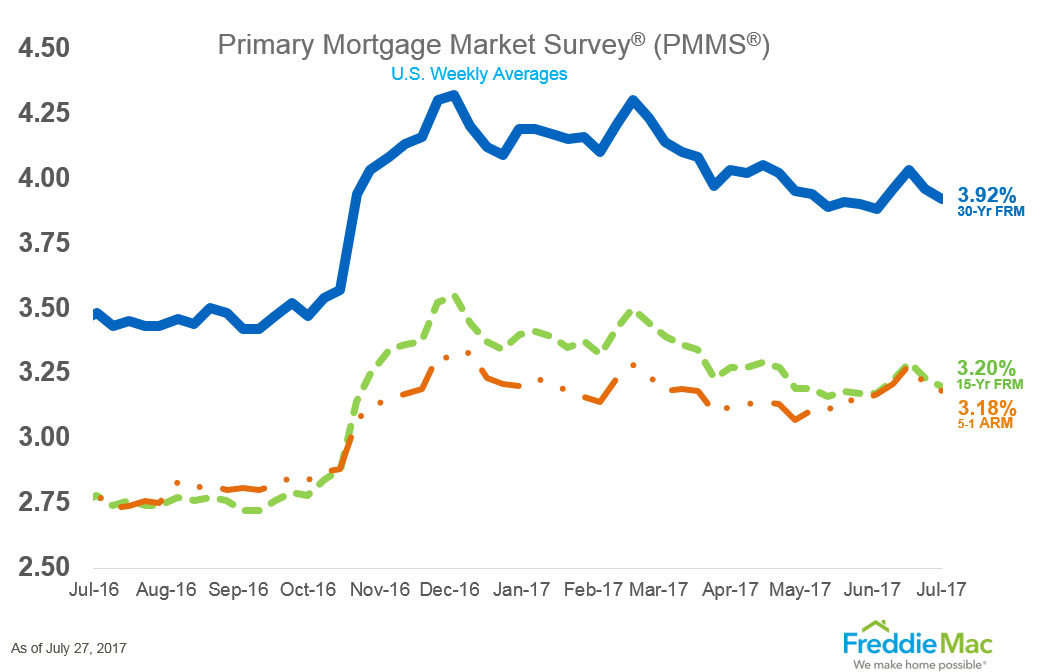
As can be seen from Freddie Mac's Mortgage Market Survey, last week, 30 Yr. Fixed Mortgage rates for conforming loans hit 3.92% with the rate falling 0.04% basis points from the previous week.
Treasury Prices Rise and Yields Fall Slightly for U.S. 10 Yr. and 30 Yr. Treasuries.
At the Chicago Board of Trade (CBOT): the US 10 Year Treasury Note futures Contract for September settlement closed at a price of 125'30.5 / 32nds; the 10 Year Note was up 4 basis points (bps) on the day, yielding 2.2889%. The US 30 Year Treasury Bond futures Contract for Sept. settlement closed at a price of 153'06 / 32nds; the 30 Year Bond was up 19 basis points (bps) on the day, yielding 2.8953%. Mortgage Rates have come off their 2017 lows and are down 0.04% bps from the previous Freddie Mac Survey last week.
Thanks to ZeroHedge.com and FreddieMac.com for Charts and Graphics.
ERATE's Daily Rate Summary
July 28, 2017
Mortgage Rates and Treasury Yields Rose Slightly.
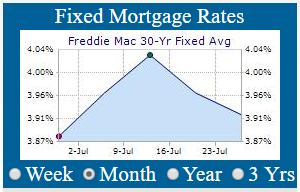
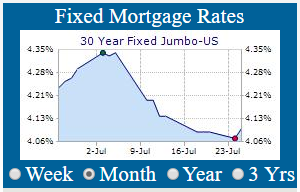
On Thursday, Treasury bond yields and Mortgage interest rates rose slightly as Credit Markets volatility increase and interest rates bounce around seeking direction. The September 10 Yr. U.S. Treasury Note stood at a yield of 2.3103% and the 30 Yr. U.S. Treasury Bond is yielding 2.9194%. 30 Year Mortgages according to Freddie Mac were around 3.92% for conforming and 4.10% for Jumbo products.
Real gross domestic product increased at an annual rate of 2.6 percent in the second quarter of 2017 (see Chart below), according to the "advance" estimate released by the Bureau of Economic Analysis (BEA). In the first quarter, real GDP increased 1.2 percent (revised downward from 1.4%).
The increase in real GDP in the second quarter reflected positive contributions from personal consumption expenditures (PCE), nonresidential fixed investment, exports, and federal government spending that were partly offset by negative contributions from private residential fixed investment, private inventory investment, and state and local government spending.
U.S. Quarterly GDP for Q2 is pegged at 2.6%
(Chart courtesy of Zerohedge.com).
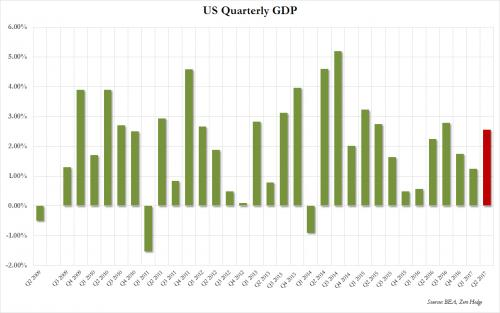
In the latest disappointment for the Federal Reserve about the economy, not only did Q2 GDP miss consensus expectations of 2.7%, but Q1 GDP of 1.4% was also revised slightly lower, to 1.2%. While the Fed's favorite inflationary metric, core Personal Consumption Expenditures (PCE), tumbled Qtr.-over- Qtr. from a downward revised 1.8% in Q1 to just 0.9% in Q2, but remained a positive contributor in the report (just barely). PCE represents about of 70% of the economy.
30 Year U.S. Treasury Bond Yield Rises to 2.9194%
(Chart courtesy of Zerohedge.com).
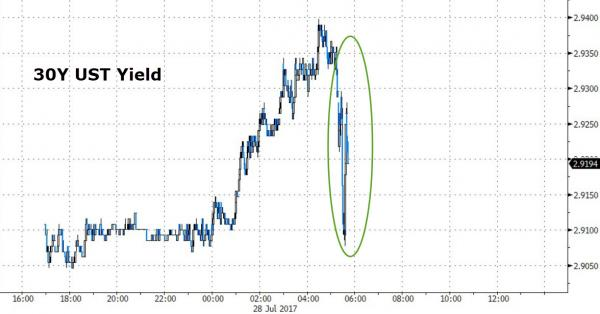
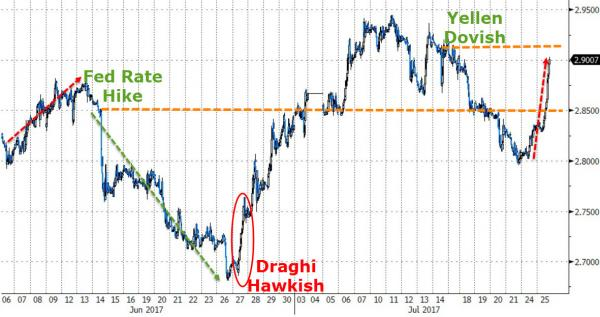
The 30 Year U.S. Treasury Bond is being whipsawed back-and-forth as successive Central Bank speakers take turns sounding-off on the near-term course of interest rate policy. Watch for Bond price volatility to increase sharply over the next several weeks as a tug-of-war between "Hawks" and "Doves" emerge in the quiet period between now the next Central Bank meetings in September.
10 Year U.S. Treasury Note Yield Rises to 2.3228%
(Chart courtesy of Zerohedge.com).
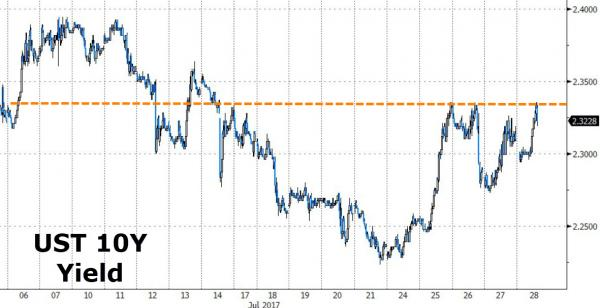
This gyration in yields is most unwelcome and will put a damper on the summer homebuying season which was already one of the weakest in recent years due to lack of supply & affordability according to Larry Yun chief economist at the National Association of Realtors (NAR).
10 Year U.S. Treasury Note Yield Longer-term View back above 50-Day MA at 2.26%
(Chart courtesy of Zerohedge.com).
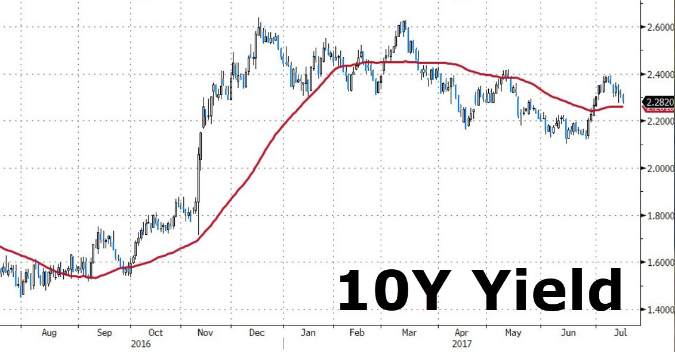
The above Chart does suggest that a constructive set-up is forming in the 10 Year Treasury Note with the potential to push the yield to around 2.00% over the next month. As Congress turns its attention to negotiations regarding the raising of the Debt-Ceiling and U.S. Government finances once again. It is crucial that Mortgage Rates stay at or below 4.00% or demand for mortgage loans will dry up. The window of opportunity for borrowers seeking mortgage refinancing & home purchases is still open for now, but for how long?
Weekly Mortgage Rates Analysis
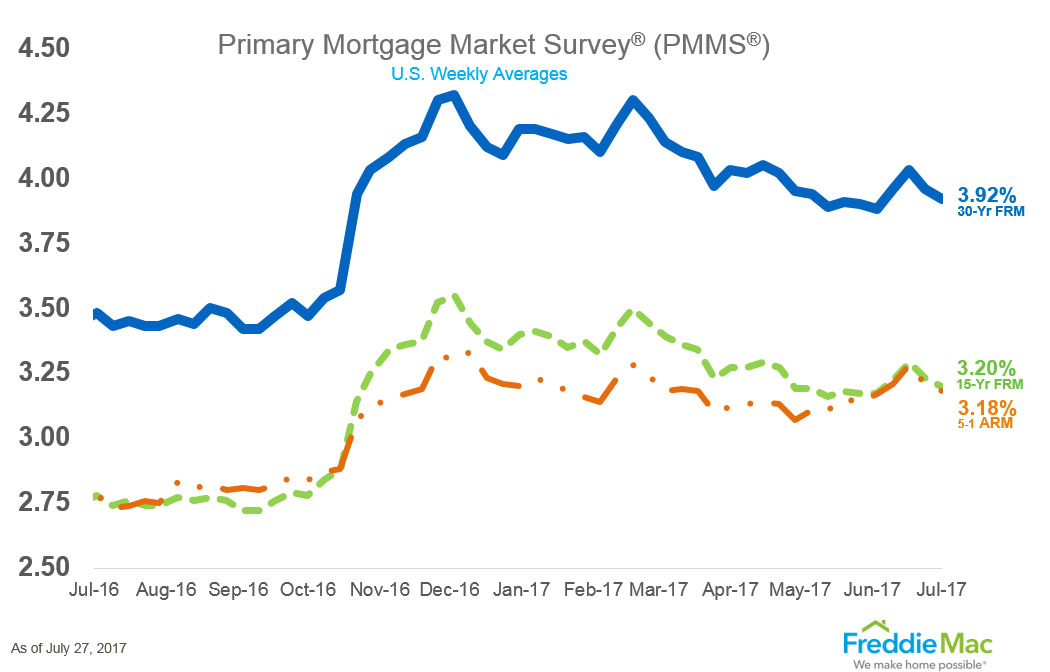
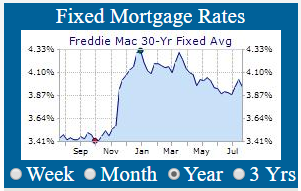
As can be seen from Freddie Mac's Mortgage Market Survey, last week, 30 Yr. Fixed Mortgage rates for conforming loans hit 3.92% with the rate falling 0.04% basis points from the previous week.
Treasury Prices Fall and Yields Rise Slightly for U.S. 10 Yr. and 30 Yr. Treasuries.
At the Chicago Board of Trade (CBOT): the US 10 Year Treasury Note futures Contract for September settlement closed at a price of 125'26.5 / 32nds; the 10 Year Note was down 6 basis points (bps) on the day, yielding 2.3103%. The US 30 Year Treasury Bond futures Contract for Sept. settlement closed at a price of 152'19 / 32nds; the 30 Year Bond was down 18 basis points (bps) on the day, yielding 2.9194%. Mortgage Rates have come off their 2017 lows and are down 0.04% bps from the previous Freddie Mac Survey last week.
Thanks to ZeroHedge.com and FreddieMac.com for Charts and Graphics.
ERATE's Daily Rate Summary
July 27, 2017
Mortgage Rates and Treasury Yields Fall Slightly.
On Wednesday, Treasury bond yields and Mortgage interest rates fell slightly as Credit Markets digest FOMC Statement for changes in interest rate policy & intentions. The September 10 Yr. U.S. Treasury Note stood at a yield of 2.2872% and the 30 Yr. U.S. Treasury Bond is yielding 2.8914%. 30 Year Mortgages according to Freddie Mac were around 3.92% for conforming and 4.10% for Jumbo products.
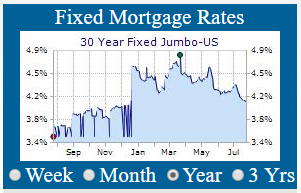
Wednesday's release of the July FOMC Statement, cast doubt on the Fed's determination with its stated program of continued rate hikes & balance sheet normalization. With ECB president Mario Drahi's hawkish comments, and Janet Yellen's dovish statement last week, 30 Year Treasury Yields are again rising above 2.85%. The big uncertainties are: interest rate neutrality, the pace & timing of Balance Sheet normalization, and will the ECB taper securities purchases in September?
U.S. Financial Conditions Index Vs. U.S. Fed Funds Rate
(Chart courtesy of Zerohedge.com).
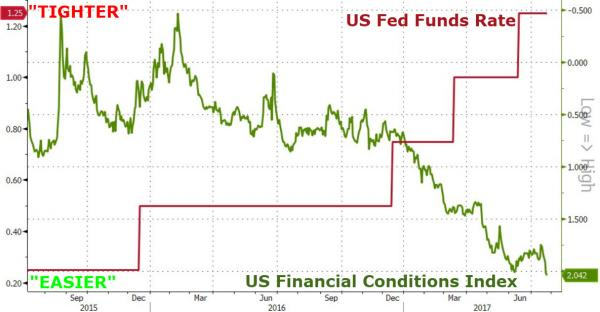
The Chart above displays the four quarter-point increases in the U.S. Federal Funds Rate since December 2015 compared with the U.S. Financial Conditions Index. As can be seen, the reality is that U.S. Financial Conditions are not "tighter" since the Fed Fund Rate increases and are in fact the "easier" than ever before. The credit markets are keying off this Financial Conditions Index and not the nominal increase in the Fed Funds Rate itself. When the Fed actually wants to "tighten" it will implement Reverse Repo operations and remove accommodation from the monetary system (i.e. money-markets) and until they execute this technical operation; the Credit Markets know that the Fed is not really serious about removing the punchbowl from the party table.
30 Year U.S. Treasury Bond Yield Rises to 2.9007%
(Chart courtesy of Zerohedge.com).
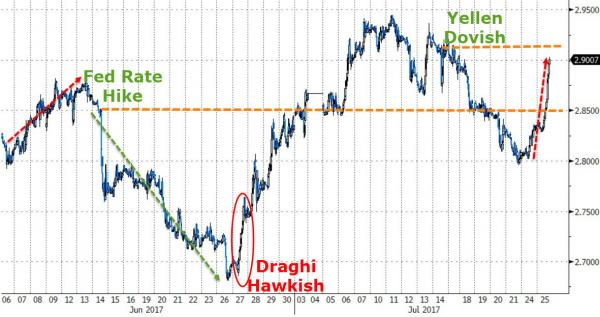
The 30 Year U.S. Treasury Bond is being whipsawed back-and-forth as successive Central Bank speakers take turns sounding-off on the near-term course of interest rate policy. Watch for Bond price volatility to increase sharply over the next several weeks as a tug-of-war between "Hawks" and "Doves" emerge in the quiet period between now the next Central Bank meetings in September.
10 Year U.S. Treasury Note Yield Rises to 2.3122%
(Chart courtesy of Zerohedge.com).
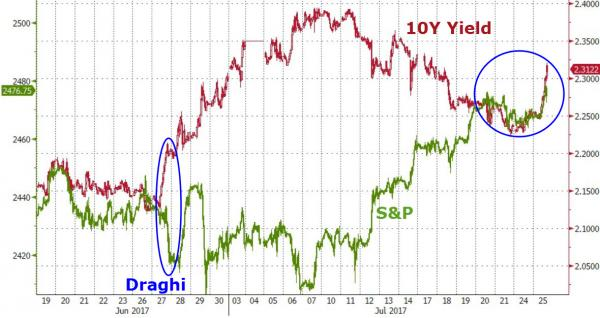
This rapid turn-around in yield is most unwelcome and will put a damper on the summer homebuying season which was already one of the weakest in recent years due to lack of supply & affordability according to Larry Yun chief economist at the National Association of Realtors (NAR).
10 Year U.S. Treasury Note Yield Longer-term View back above 50-Day MA at 2.26%
(Chart courtesy of Zerohedge.com).
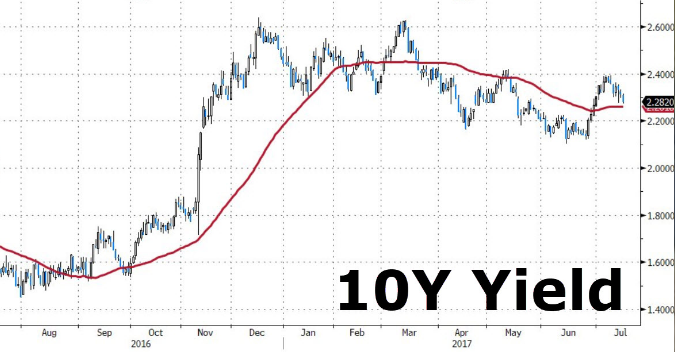
The above Chart does suggest that a constructive set-up is forming in the 10 Year Treasury Note with the potential to push the yield to around 2.00% over the next few weeks. As Congress turns its attention to negotiations regarding the raising of the Debt-Ceiling and U.S. Government finances once again. It is crucial that Mortgage Rates stay at or below 4.00% or demand for mortgage loans will dry up. The window of opportunity for borrowers seeking mortgage refinancing & home purchases is still open for now, but for how long?
Weekly Mortgage Rates Analysis
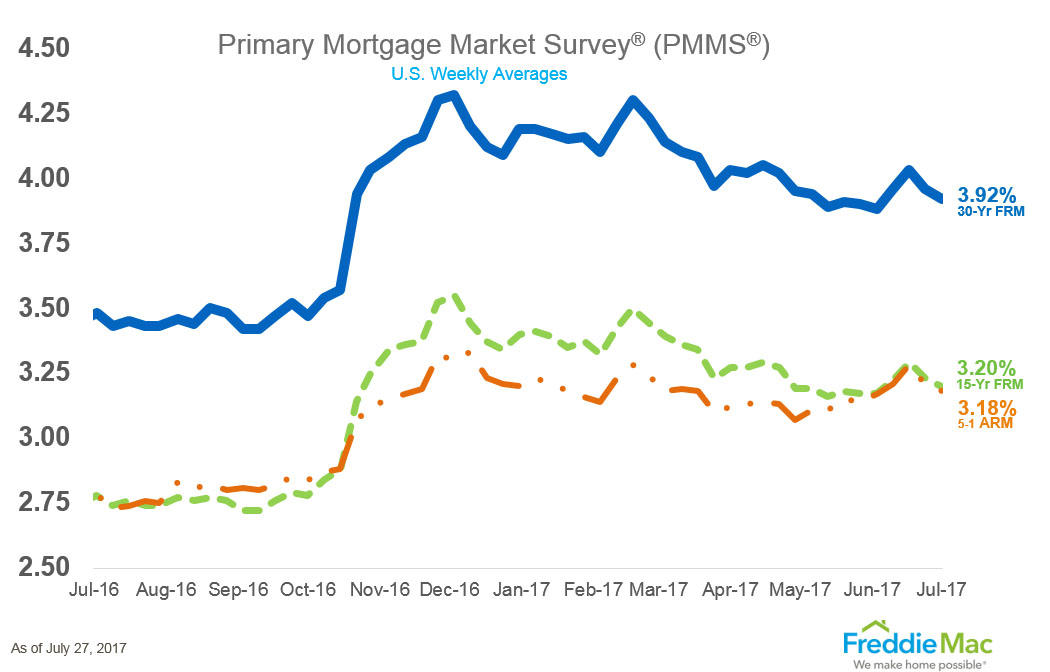
As can be seen from Freddie Mac's Mortgage Market Survey, last week, 30 Yr. Fixed Mortgage rates for conforming loans hit 3.92% with the rate falling 0.04% basis points from the previous week.
Treasury Prices Rise and Yields Fall Slightly for U.S. 10 Yr. and 30 Yr. Treasuries.
At the Chicago Board of Trade (CBOT): the US 10 Year Treasury Note futures Contract for September settlement closed at a price of 126'005 / 32nds; the 10 Year Note was up 14 basis points (bps) on the day, yielding 2.2872%. The US 30 Year Treasury Bond futures Contract for Sept. settlement closed at a price of 153'05 / 32nds; the 30 Year Bond was up 17 basis points (bps) on the day, yielding 2.8914%. Mortgage Rates have come off their 2017 lows and are down 0.04% bps from the previous Freddie Mac Survey last week.
Thanks to ZeroHedge.com and FreddieMac.com for Charts and Graphics.
ERATE's Daily Rate Summary
July 26, 2017
Mortgage Rates and Treasury Yields Rise.
On Tuesday, Treasury bond yields and Mortgage interest rates rose slightly as market participants await news from FOMC about the path of interest rates, inflation expectations, and BS normalization. The September 10 Yr. U.S. Treasury Note stood at a yield of 2.3354% and the 30 Yr. U.S. Treasury Bond is yielding 2.9171%. 30 Year Mortgages according to Freddie Mac were around 3.96% for conforming and 4.10% for Jumbo products.
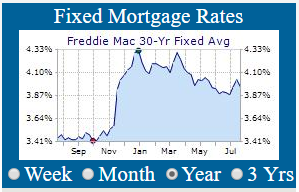
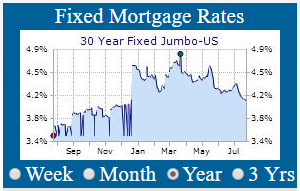
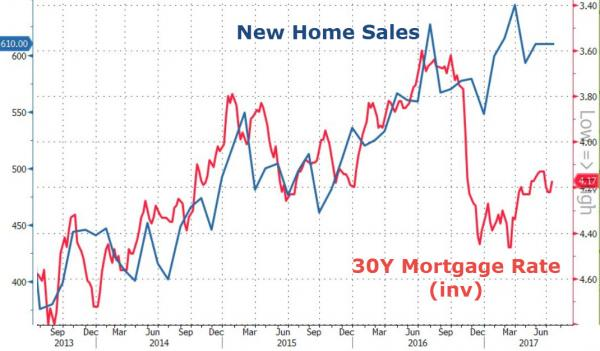
The Commerce Department said Wednesday that in June New-Home Sales edged up 0.8 percent to a seasonally adjusted annual rate of 610,000 (SAAR). Sales have registered a healthy 10.9 percent increase so far this year. May was revised down for both Sales and Median prices. This is disappointing as expectations were for a rise to 615k units (SAAR) rate. For comparison, the Chart displays the average 30 Year Mortgage interest rate for conventional loans was 4.17% in June.
New Home Sales Vs. 30Yr. Mortgage Rates (Inv)
(Chart courtesy of Zerohedge.com).
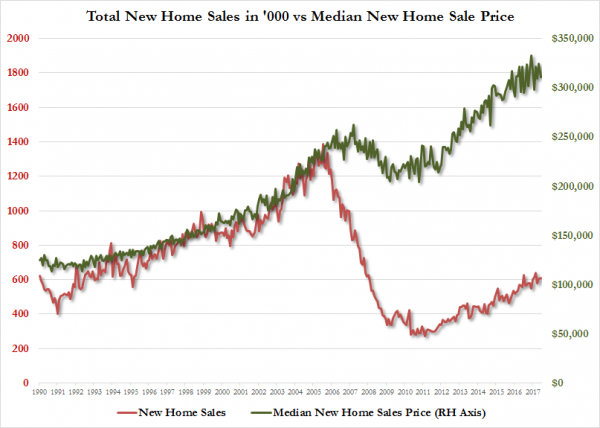
In June, the median sales price of a new home fell 3.3 percent to $310,800 down slightly from May's revised $323,400 Median Sale Price. The May median price was originally reported at $345,800 (a record).
New Home Sale (000's) vs Median Sales Prices Historical Comparison (1990 to Present)
(Chart courtesy of Zerohedge.com).
Rates have improved with rates falling back below 4.00% again (this compares to a year ago when they were at all-time lows of 3.60% this time last summer). "When taking into account the size of the U.S., new home sales are still about 30 percent below the 50-year average," said Ralph McLaughlin, chief economist at the real estate firm Trulia. "But the signs for home builders are clear: if you build, they will come."
Sales last month advanced in the Midwest and West, but purchases were unchanged in the Northeast and dropped in the South.
The June sales report indicates that the price and supply pressures will continue.
Homebuilder Optimism Vs. New Home Sale Historical (1990 to Present)
(Chart courtesy of Zerohedge.com).
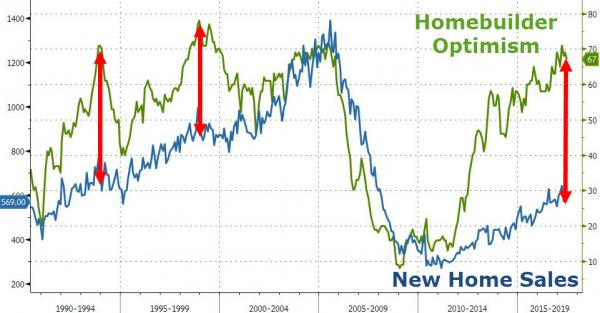
The above Chart of Homebuilder Optimism when compared to New Home Sales shows is that levels of Sales never rebounded to previous levels before the GFC; even though Homebuilder Optimism is at levels that were achieved prior to the GFC in 2006. Of course, homebuilders remain blissfully ignorant of the actual state of the housing 'recovery' - with the biggest gap between hope and home sales ever...when looking at the historical record & cyclical nature of the homebuilding industry.
10 Year U.S. Treasury Note Yield has since Risen to 2.3247%
(Chart courtesy of Zerohedge.com).
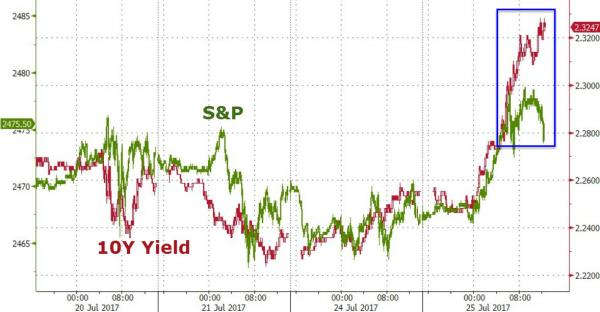
The recent action in the above Chart is disappointing as a constructive set-up was forming in the 10 Year Treasury Note at the 2.23% level with the potential to push the yield to around 2.00% over the next month. It is crucial that Mortgage Rates stay at or below 4.00% or demand for mortgage loans will dry up. The window of opportunity for borrowers seeking mortgage refinancing & home purchases is still open for now, but for how long?
Weekly Mortgage Rates Analysis
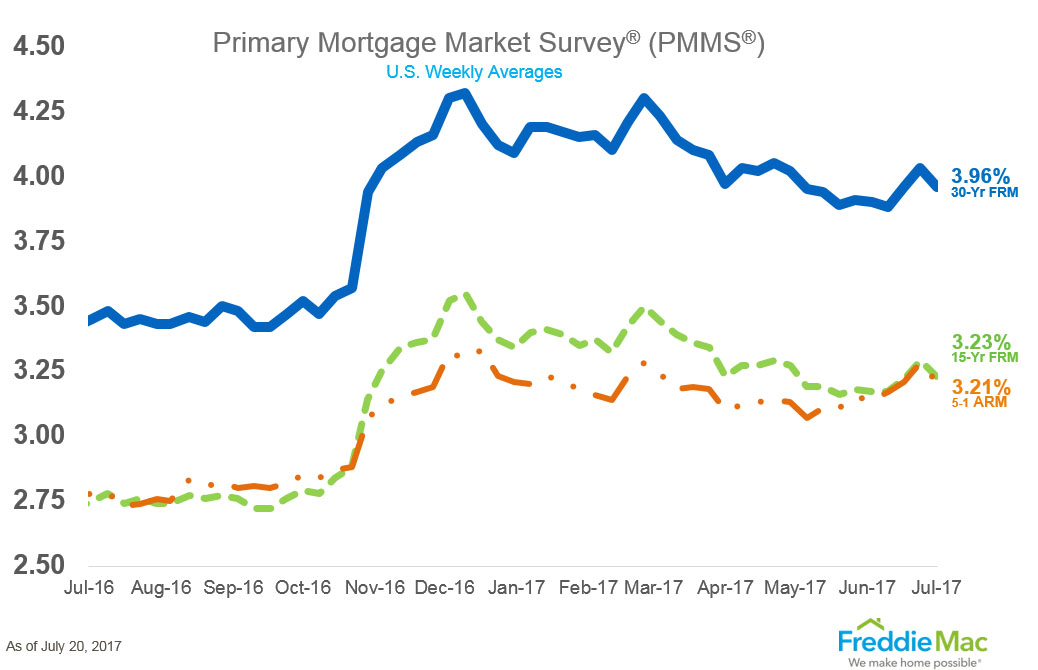
As can be seen from Freddie Mac's Mortgage Market Survey, last week, 30 Yr. Fixed Mortgage rates for conforming loans hit 3.96% with the rate falling 0.07% basis points from the previous week.
Treasury Prices Fall and Yields Rise for U.S. 10 Yr. and 30 Yr. Treasuries.
At the Chicago Board of Trade (CBOT): the US 10 Year Treasury Note futures Contract for September settlement closed at a price of 125'18.5 / 32nds; the 10 Year Note was down 18.5 basis points (bps) on the day, yielding 2.3354%. The US 30 Year Treasury Bond futures Contract for Sept. settlement closed at a price of 152'20 / 32nds; the 30 Year Bond was down 52 basis points (bps) on the day, yielding 2.9171%. Mortgage Rates have come off their 2017 lows and are down 0.07% bps from the previous Freddie Mac Survey last week.
Thanks to ZeroHedge.com, National Association of Realtors (NAR), and FreddieMac.com for Charts and Graphics.
ERATE's Daily Rate Summary
July 25, 2017
Mortgage Rates and Treasury Yields Rise Slightly.
On Monday, Treasury bond yields and Mortgage interest rates rose slightly as Credit Markets digest Central Banks interest rate intentions. The September 10 Yr. U.S. Treasury Note stood at a yield of 2.2552% and the 30 Yr. U.S. Treasury Bond is yielding 2.8345%. 30 Year Mortgages according to Freddie Mac were around 3.96% for conforming and 4.09% for Jumbo products.
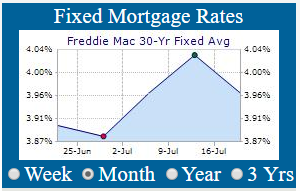
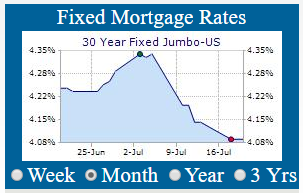
In the aftermath of the June Fed Rate Hike, ECB president Mario Drahi's hawkish comments, and Janet Yellen's dovish statement last week, 30 Year Treasury Yields are again rising above 2.85%. The big uncertainties are interest rate rises almost done, what will be the pace & timing of Balance Sheet normalization, and will the ECB begin to curtail its securities purchases in September?
30 Year U.S. Treasury Bond Yield Rises to 2.9007%
(Chart courtesy of Zerohedge.com).
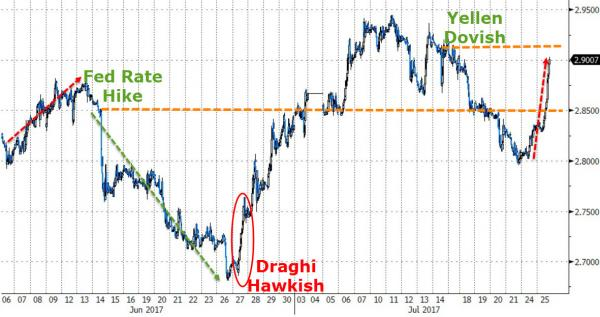
This rapid increase in Yields also affected the 10 Year U.S. Treasury Note as well which is the benchmark for Mortgage interest rates. With a 10 Bps rise in just over 24 hours to above 2.30%. This is indicative of a market searching for direction in the light of contradictory communication.
10 Year U.S. Treasury Note Yield Rises to 2.3122%
(Chart courtesy of Zerohedge.com).
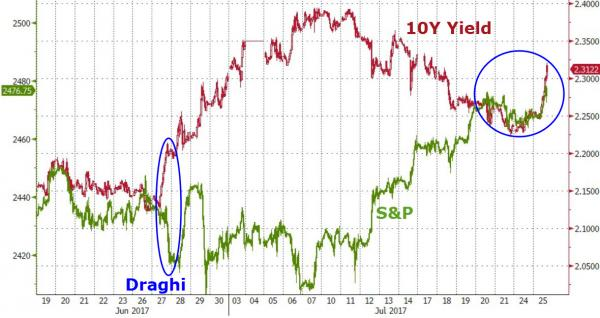
This rapid turn-around in yield is most unwelcome and will put a damper on the summer homebuying season which was already one of the weakest in recent years due to lack of supply & affordability according to Larry Yun chief economist at the National Association of Realtors (NAR).
10 Year U.S. Treasury Note Yield Longer-term View back above 50-Day MA at 2.26%
(Chart courtesy of Zerohedge.com).
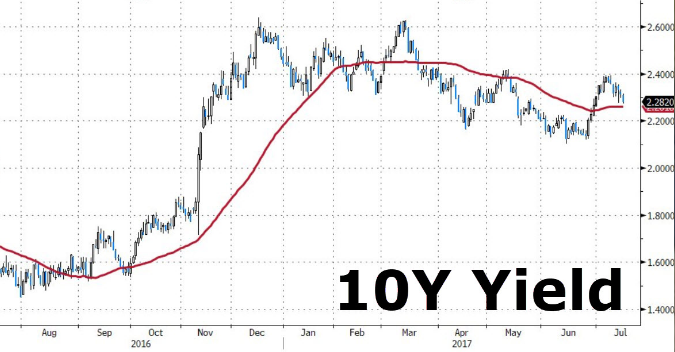
The above Chart does suggest that a constructive set-up is forming in the 10 Year Treasury Note with the potential to push the yield to around 2.00% over the next few weeks. As Congress turns its attention to negotiations regarding the raising of the Debt-Ceiling and U.S. Government finances once again. It is crucial that Mortgage Rates stay at or below 4.00% or demand for mortgage loans will dry up. The window of opportunity for borrowers seeking mortgage refinancing & home purchases is still open for now, but for how long?
Weekly Mortgage Rates Analysis
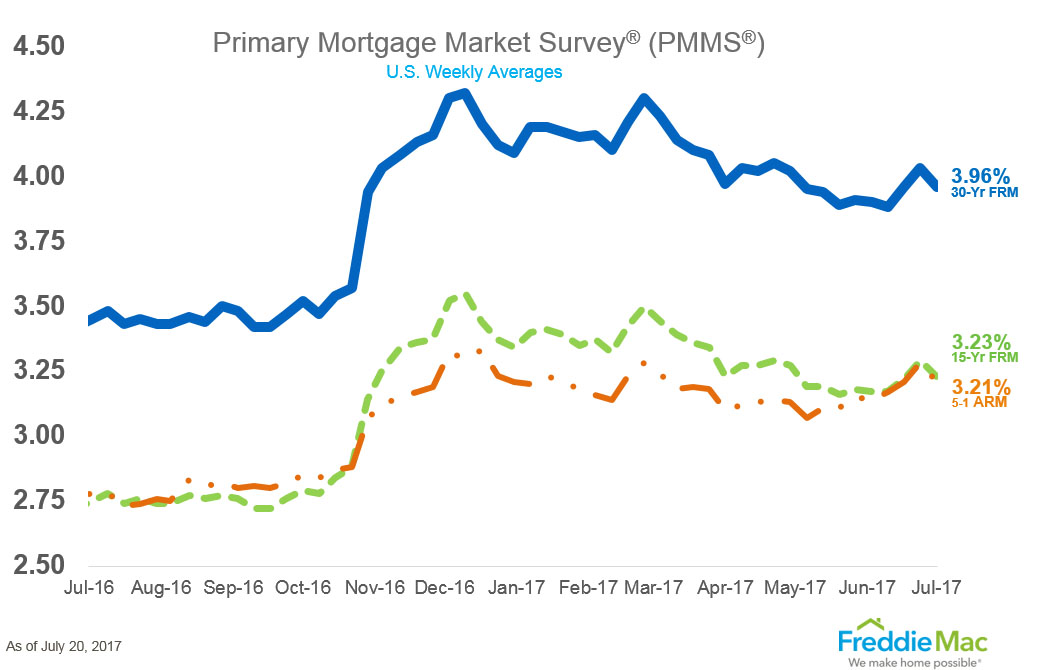
As can be seen from Freddie Mac's Mortgage Market Survey, last week, 30 Yr. Fixed Mortgage rates for conforming loans hit 3.96% with the rate falling 0.07% basis points from the previous week.
Treasury Prices Fall and Yields Rise for U.S. 10 Yr. and 30 Yr. Treasuries.
At the Chicago Board of Trade (CBOT): the US 10 Year Treasury Note futures Contract for September settlement closed at a price of 126'05 / 32nds; the 10 Year Note was down 5 basis points (bps) on the day, yielding 2.2552%. The US 30 Year Treasury Bond futures Contract for Sept. settlement closed at a price of 154'08 / 32nds; the 30 Year Bond was down 17 basis points (bps) on the day, yielding 2.8345%. Mortgage Rates have come off their 2017 lows and are down 0.07% bps from the previous Freddie Mac Survey last week.
Thanks to ZeroHedge.com, National Association of Realtors (NAR), and FreddieMac.com for Charts and Graphics.
ERATE's Daily Rate Summary
July 24, 2017
Mortgage Rates and Treasury Yields Fall.
On Friday, Treasury bond yields and Mortgage interest rates fell slightly as Central Banks hint at lower for longer interest rates due to a pause in inflation expectations. The September 10 Yr. U.S. Treasury Note stood at a yield of 2.2375% and the 30 Yr. U.S. Treasury Bond is yielding 2.8087%. 30 Year Mortgages according to Freddie Mac were around 3.96% for conforming and 4.09% for Jumbo products.
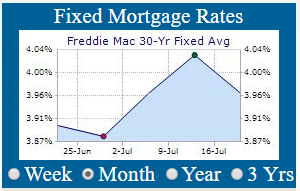
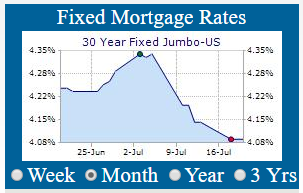
In June, Existing Home Sales fell -1.8% to 5.52 million units on a Seasonally Adjusted Annual Rate (SAAR) from May's 5.62 million unit (SAAR) rate. This is the slowest existing home selling rate since the 5.47 million unit rate print in February 2017. Existing home sales are now unchanged since September 2016, but we note that average prices are up 6.5% YoY. Interest rates & home affordability are becoming an issue in select pricier markets (coastal & major metro areas).
Existing Home Sales Vs. 30Yr. Mortgage Rates (Inv)
(Chart courtesy of Zerohedge.com).
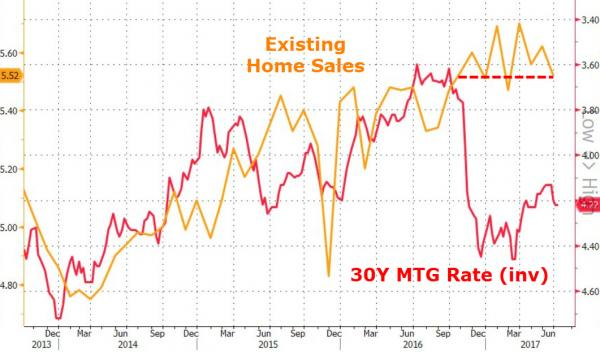
In July, Mortgage Rates have improved with rates falling back below 4.00% again (this compares to a year ago when they were at all-time lows of 3.60% this time last summer). Existing Home Sales are only up 0.7% on a year-over-year basis, while affordability in not helping sales. Lawrence Yun, NAR chief economist, says the previous three-month lull in contract activity translated to a pullback in existing sales in June.
"Closings were down in most of the country last month because interested buyers are being tripped up by supply that remains stuck at a meager level and price growth that's straining their budget," he said.
"The demand for buying a home is as strong as it has been since before the Great Recession. Listings in the affordable price range continue to be scooped up rapidly, but the severe housing shortages inflicting many markets are keeping a large segment of would-be buyers on the sidelines."
For context, this is the weakest summer selling season since 2011... a time when seasonally sales have tended to increase...
Existing Home Sales Historical Comparison (2012 – 2017Ytd)
(Chart courtesy of Zerohedge.com).
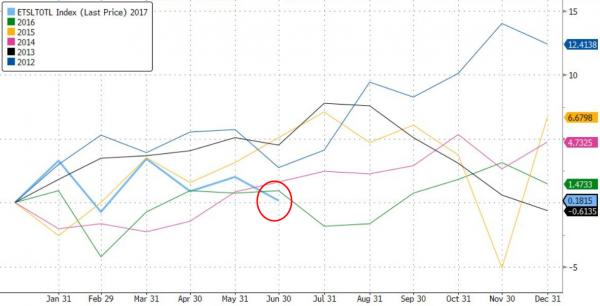
First-time buyers made up 32 percent of sales in June, which is down from 33 percent both in May and a year ago. NAR's 2016 Profile of Home Buyers and Sellers – released in late 2016 – revealed that the annual share of first-time buyers was 35 percent.
"It's shaping up to be another year of below average sales to first-time buyers despite a healthy economy that continues to create jobs," said Yun.
"Worsening supply and affordability conditions in many markets have unfortunately put a temporary hold on many aspiring buyers' dreams of owning a home this year." The median existing-home price for all housing types in June was $263,800, up 6.5 percent from June 2016 ($247,600).
Percent Change in Sales From a Year Ago by Price Range
Chart courtesy of National Association of Realtors (NAR).
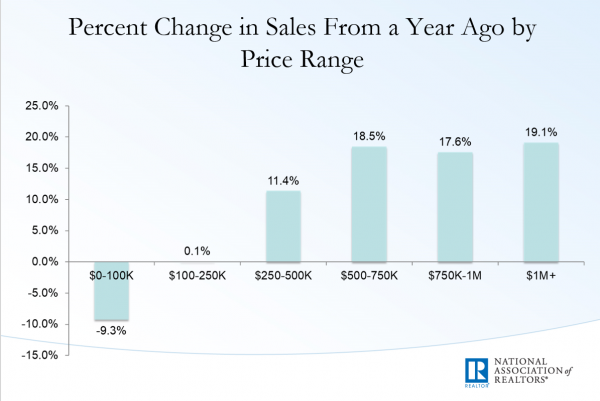
What the Chart from (NAR) shows is that supply of affordable existing homes is being squeezed, and new home buyers are increasingly being priced out of the market.
10 Year U.S. Treasury Note Yield has since Fallen to 2.2375%
(Chart courtesy of Zerohedge.com).
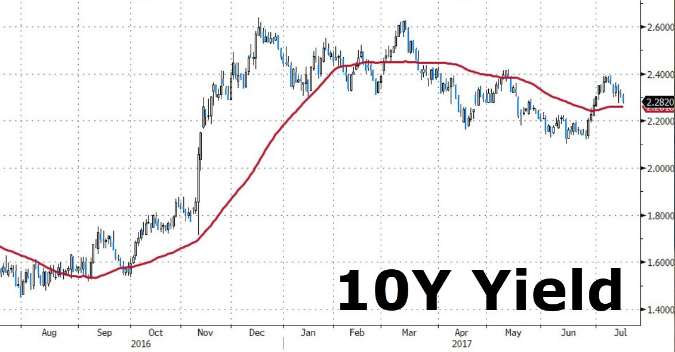
The above Chart does suggest that a constructive set-up is forming in the 10 Year Treasury Note with the potential to push the yield to around 2.00% over the next few weeks. As Congress turns its attention to negotiations regarding the raising of the Debt-Ceiling and U.S. Government finances once again. It is crucial that Mortgage Rates stay at or below 4.00% or demand for mortgage loans will dry up. The window of opportunity for borrowers seeking mortgage refinancing & home purchases is still open for now, but for how long?
Weekly Mortgage Rates Analysis
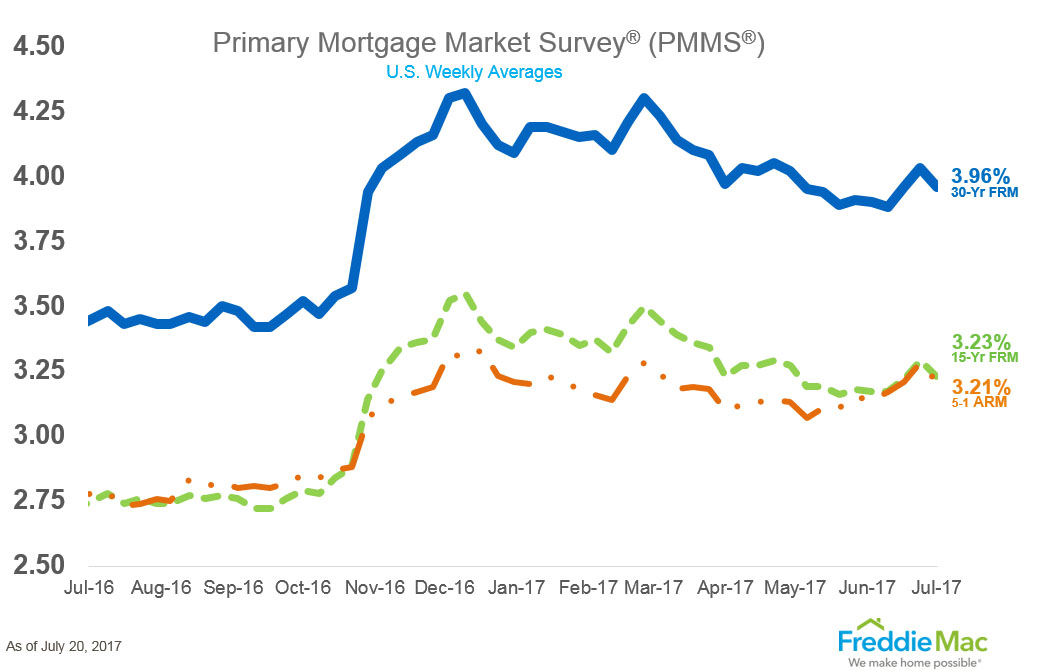
As can be seen from Freddie Mac's Mortgage Market Survey, last week, 30 Yr. Fixed Mortgage rates for conforming loans hit 3.96% with the rate falling 0.07% basis points from the previous week.
Treasury Prices Rise and Yields Fall for U.S. 10 Yr. and 30 Yr. Treasuries.
At the Chicago Board of Trade (CBOT): the US 10 Year Treasury Note futures Contract for September settlement closed at a price of 126'10 / 32nds; the 10 Year Note was up 8 basis points (bps) on the day, yielding 2.2375%. The US 30 Year Treasury Bond futures Contract for Sept. settlement closed at a price of 154'25 / 32nds; the 30 Year Bond was up 23 basis points (bps) on the day, yielding 2.8087%. Mortgage Rates have come off their 2017 lows and are down 0.07% bps from the previous Freddie Mac Survey last week.
Thanks to ZeroHedge.com, National Association of Realtors (NAR), and FreddieMac.com for Charts and Graphics.
ERATE's Daily Rate Summary
July 21, 2017
Mortgage Rates and Treasury Yields Fall Slightly.
On Thursday, Treasury bond yields and Mortgage interest rates fell slightly as ECB President, Mario Draghi's 'dovish' comments signaled he's in no hurry to taper bond buying put a bid under Treasury Prices. The September 10 Yr. U.S. Treasury Note stood at a yield of 2.2589% and the 30 Yr. U.S. Treasury Bond is yielding 2.8254%. 30 Year Mortgages according to Freddie Mac were around 3.96% for conforming and 4.09% for Jumbo products.
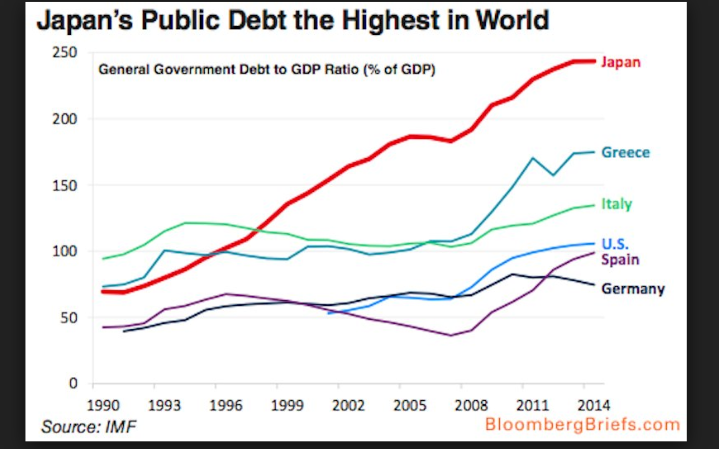
Japan's Public Debt is the highest in the world at just under 250% of GDP. Why is this important? As the chart below shows, other Western nations (including the U.S.) have breached what economist say is the key level of 90% of GDP. Anything above this level is lethal in the long-run to a Sovereign Fiat currency and economy tied to it. Mess with a medium-of-exchange and all manner of economic relationships unravel.
General Government Debt to GDP Ratio (% of GDP)
(Chart courtesy of BloombergBriefs.com).
Combined Central Bank Balance Sheet >$13.5 Trillion (USD)
(Chart courtesy of Zerohedge.com).
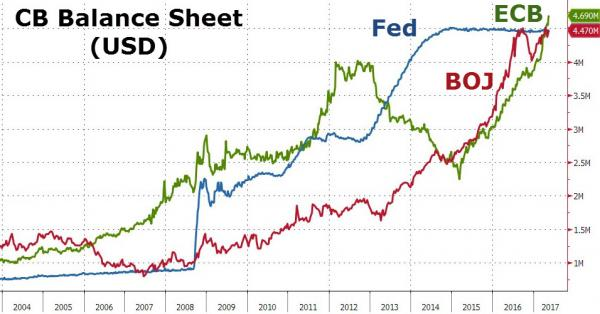
The Central Bank's Balance Sheets now total greater than $13.5 Trillion dollars. From the Chart above the Fed, ECB, and BOJ are now on a path of unsustainable debt increase. Up until the present, the detrimental effects of this policy have been muted while the positive effects have been embraced. My economics professor taught me the lesson that 'there is no free lunch' and that consequences always follow from believing there is. The most dangerous mainstream economic idea going is that Inflation is too low. Insurance companies, defined benefit pensions and savers have been paying the price for this misguided theory. Inflation helps greatly those who are deeply indebted by making payments 'more affordable' because their paid back in cheaper dollars.
Net Central Bank Asset Purchases from 2009 to Present (US $ Billions)
(Chart courtesy of Haver and Citi Research).
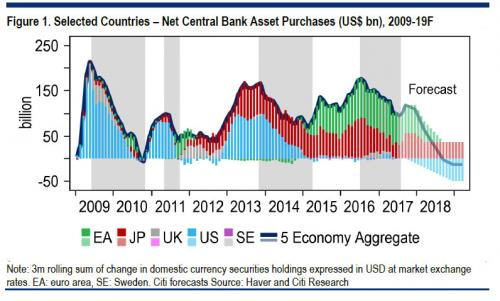
If the Central Banks are going to now back away from buying additional Assets and begin to reverse course and pare down their Balance Sheets; who in the private sector is going to be the buyer and at what price? After all, Central Banks acquired these assets at full value from private sellers as the buyer of last resort when no one else could or would. There are consequences for foolish actions and I don't think that the CB's have thought through all the capital losses & market turmoil that will ensue; if in fact, true price discovery and the marketplace is allowed to work and a market clearing price is found for these securities. Can you say, 'Big Bond Bubble Top' coming?
U.S. Short-term Gov't T-Bill Yields Rise to 1.13%
(Chart courtesy of Zerohedge.com).
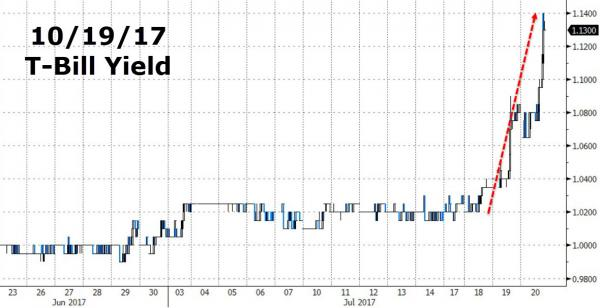
All things financial seem calm at the moment. But the game is quietly changing and we are seeing the same signs of trouble with Money Markets as prior to the Great Financial Crisis. The Debt-Ceiling negotiations and Budget Showdown in Congress is going shock the unprepared this fall, as trust in counter-parties is again eroding under the surface. We've seen this movie before, is there no one going to be left standing the next time it falls apart and a 'Buyer of last resort' cannot be found.
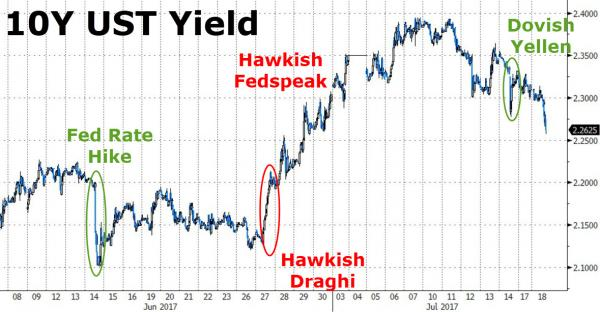
10 Year U.S. Treasury Note Yield Falls to 2.2625%
(Chart courtesy of Zerohedge.com).
Here is a longer timeframe view of the 10 Yr. Treasury Note yield…
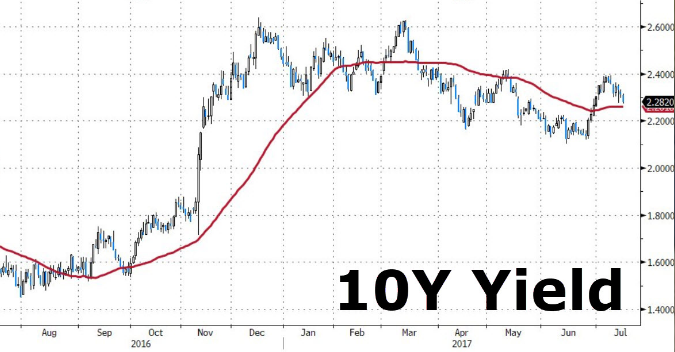
The above Chart does suggest that a constructive set-up is forming in the 10 Year Treasury Note with the potential to push the yield to around 2.00% over the next few weeks. As Congress turns its attention to negotiations regarding the raisin of the Debt-Ceiling and U.S. Government finances once again. It is crucial that Mortgage Rates stay at or below 4.00% or demand for mortgage loans will dry up. The window of opportunity for borrowers seeking mortgage refinancing & home purchases is still open for now, but for how long?
Weekly Mortgage Rates Analysis
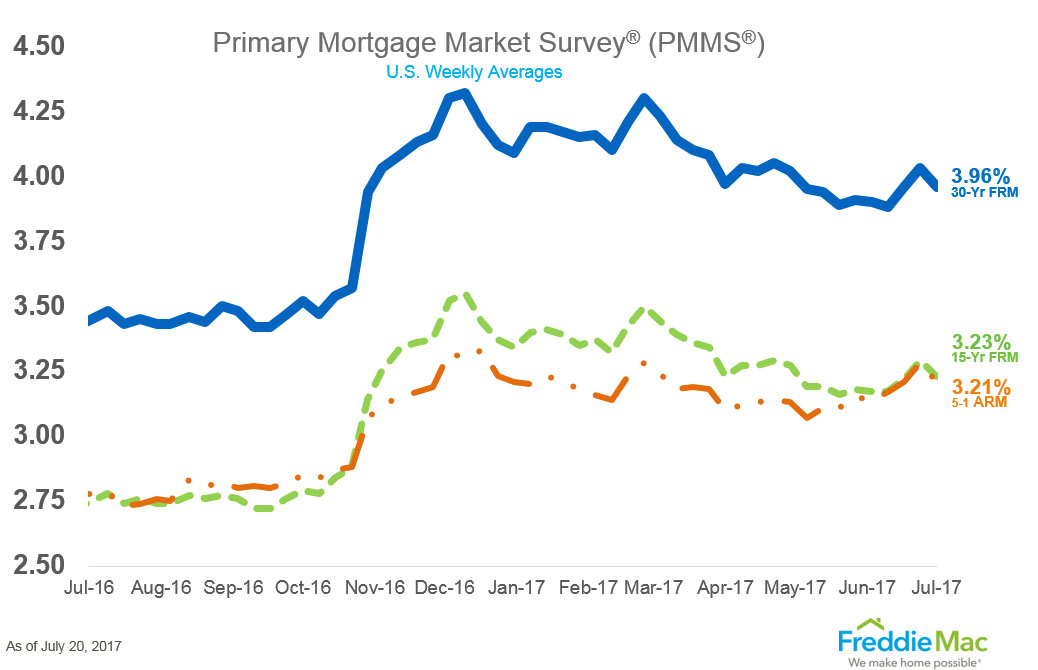
As can be seen from Freddie Mac's Mortgage Market Survey, last week, 30 Yr. Fixed Mortgage rates for conforming loans hit 3.96% with the rate falling 0.07% basis points from the previous week.
Treasury Prices and Yields Steady for U.S. 10 Yr. and 30 Yr. Treasuries.
At the Chicago Board of Trade (CBOT): the US 10 Year Treasury Note futures Contract for September settlement closed at a price of 126'02 / 32nds; the 10 Year Note was up a half basis points (bps) on the day, yielding 2.2589%. The US 30 Year Treasury Bond futures Contract for Sept. settlement closed at a price of 154'02 / 32nds; the 30 Year Bond was up 4 basis points (bps) on the day, yielding 2.8254%. Mortgage Rates have come off their 2017 lows and are down 0.07% bps from the previous Freddie Mac Survey last week.
Thanks to ZeroHedge.com, Haver and Citi Research, BloombergBriefs.com, FreddieMac.com for Charts and Graphics.
ERATE's Daily Rate Summary
July 20, 2017
Mortgage Rates and Treasury Yields Slightly Mixed.
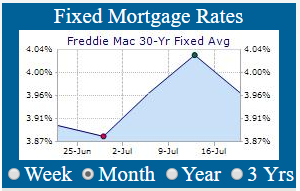
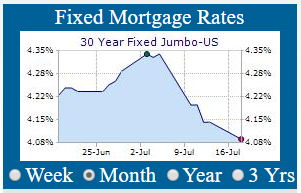
On Wednesday, Treasury bond yields and Mortgage interest rates were mostly unchanged as Markets awaits ECB President, Mario Draghi's comments. It is the ECB's turn for QE and next on deck will be the Kuroda's BOJ in this merry-go-round of endless & pointless liquidity. The point of no return has long been reached where Central Banks have to admit that they are the markets' (every & at all times) and there can be no real net removal of accommodation or things will break greatly in this synthetically controlled command economy. Either the CB's make up fake markets or securities go bid-less; it's that simple! The September 10 Yr. U.S. Treasury Note stood at a yield of 2.2696% and the 30 Yr. U.S. Treasury Bond is yielding 2.8514%. 30 Year Mortgages according to Freddie Mac were around 3.96% for conforming and 4.09% for Jumbo products.
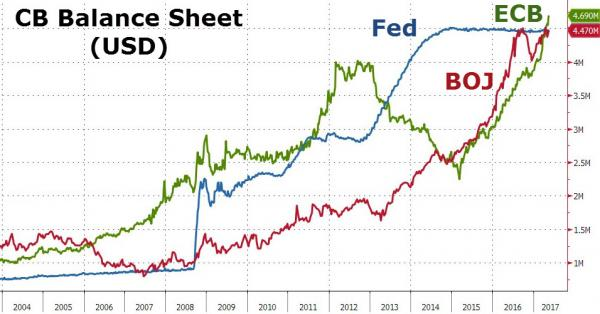
As the chart below confirms, every Central Bank in this daisy-chain of Quantitative Easing has now taken their turn and each CB Balance Sheet is now individually at or over $4.5 Trillion. Just stop and think what this represents: many multiples of future annual World GDP have been conjured-up (borrowed into existence) to pull future consumption into the present to fill the hole (depression) in present world-wide consumptive activity for going-on nine years to solve a problem initially on the order of only $800B during the GFC. Pitiful problem analysis, reasoning & solutions applied from the smartest guys in the room!
Central Bank Balance Sheets (USD) (Chart courtesy of Zerohedge.com).
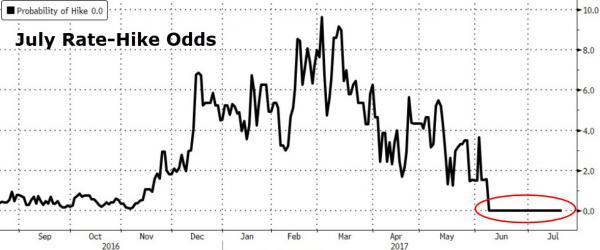
From the Chart below the Odds of a surprise FOMC July Rate-Hike have flatlined at 0% probability. The CB's really have no intention to "normalize" anything; interest rates, balance sheets, liquidity, and/or QE because they can't and know the system will destabilize again the moment they stop becoming the "Market" for assets. Their cornered and committed to doing the same things that haven't worked up to this point, hoping for a different outcome. Definition of Insanity…
July Rate-Hike Odds Hit 0%
(Chart courtesy of Zerohedge.com).
As can be seen from the from the below Chart courtesy of Haver and Citi Research the CB's have been taking turns the U.S. Fed is mostly done since 2014, it was the Bank of Japan's turn next, and now ECB is in the driver's seat of Quantitative Easing. What happens when/if the 2019 Forecast is true and it all ends? Will the markets suddenly come back to life on their own and provide liquidity, true real-time price-discovery for asset values again and make fake markets disappear?
Net Central Bank Asset Purchases from 2009 to Present (US $ Billions)
(Chart courtesy of Haver and Citi Research).
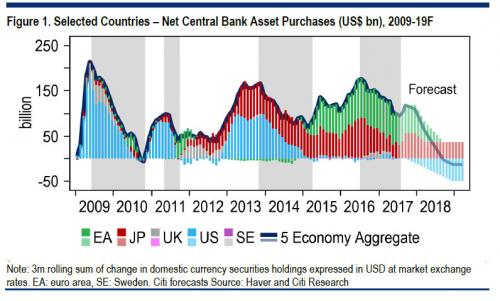
Meanwhile, according to Thomson Reuters, Credit Suisse (see Chart below). The Corporate Sector has been the main (only) buyer of U.S. equities since the 2009 market low. The corporations are buying their own stock to reduce share counts (the divisor in the earnings equation) by borrowing large sums of money to meet/beat EPS targets. However, if interest rates rise then companies will no longer be able to manipulate their stocks price levels by engineered financial performance results each quarter. Can you say, 'Big Stock Market Top' coming?
Recent Historical Cumulative buying/selling of U.S. Equities, by % Market Cap
(Chart courtesy of Thomson Reuters, Credit Suisse).
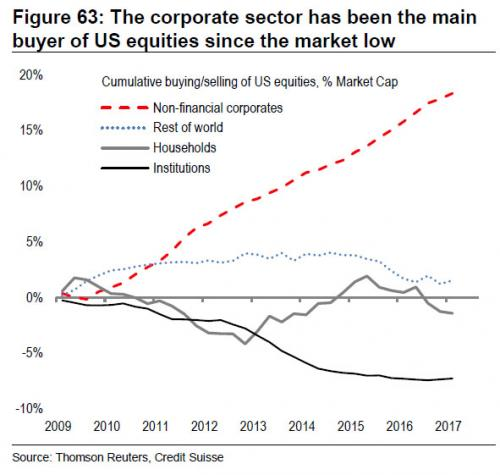
It's a game of Whose-It with the Debt-Creation Hot Potato and continuation of privatized-gains and socialized-losses, when it ultimately all fails again like in 2009 GFC. We've seen this movie before, is there no one going to be left standing the next time it falls apart.
10 Year U.S. Treasury Note Yield Falls to 2.2625%
(Chart courtesy of Zerohedge.com).
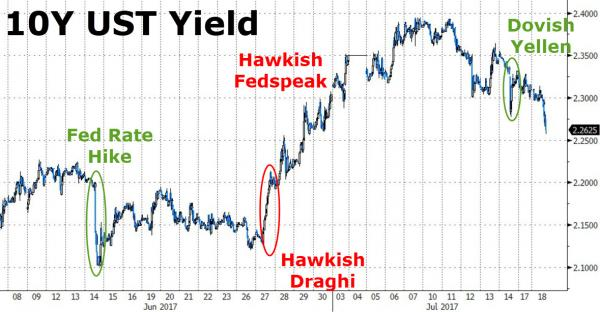
Here is a longer timeframe view of the 10 Yr. Treasury Note yield…
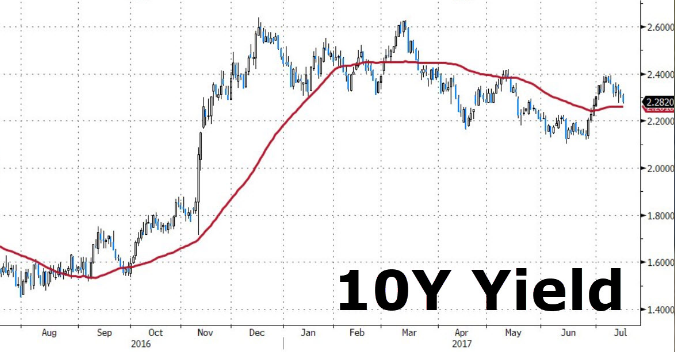
The above Chart does suggest that a constructive set-up is forming in the 10 Year Treasury Note with the potential to push the yield to around 2.00% over the next few weeks. As Congress turns its attention to negotiations regarding the raisin of the Debt-Ceiling and U.S. Government finances once again. It is crucial that Mortgage Rates stay at or below 4.00% or demand for mortgage loans will dry up. The window of opportunity for borrowers seeking mortgage refinancing & home purchases is still open for now, but for how long?
Weekly Mortgage Rates Analysis
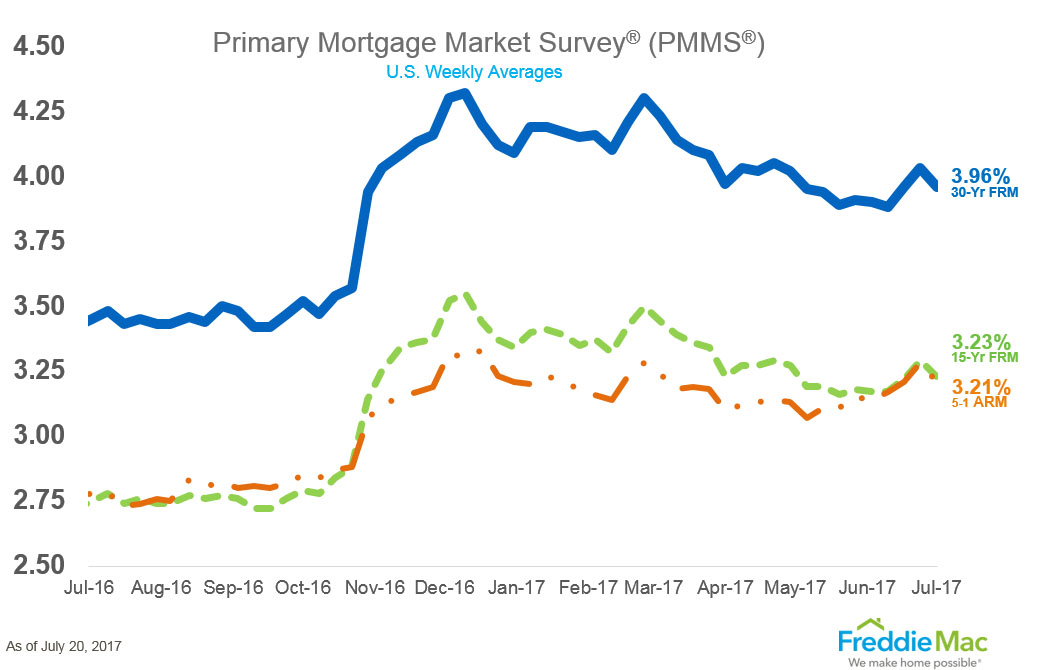
As can be seen from Freddie Mac's Mortgage Market Survey, last week, 30 Yr. Fixed Mortgage rates for conforming loans hit 3.96% with the rate falling 0.07% basis points from the previous week.
Treasury Prices Mixed and Yields Steady for U.S. 10 Yr. and 30 Yr. Treasuries.
At the Chicago Board of Trade (CBOT): the US 10 Year Treasury Note futures Contract for September settlement closed at a price of 126'01.5 / 32nds; the 10 Year Note was down 2 basis points (bps) on the day, yielding 2.2696%. The US 30 Year Treasury Bond futures Contract for Sept. settlement closed at a price of 153'30 / 32nds; the 30 Year Bond was up 3 basis points (bps) on the day, yielding 2.8514%. Mortgage Rates have come off their 2017 lows and are down 0.07% bps from the previous Freddie Mac Survey last week.
Thanks to ZeroHedge.com, Haver and Citi Research, Thomson Reuters, FreddieMac.com for Charts and Graphics.
ERATE's Daily Rate Summary
July 19, 2017
Mortgage Rates and Treasury Yields Fall.
On Tuesday, Treasury bond yields and Mortgage interest rates fell hard as the credit markets speculate on future Fed Interest Rate moves. Yesterday, the market was digesting the meaning of the phrase interest rate 'Neutrality'; today, may be the day it refocuses on 'Normalization' and the 'Trajectory of U.S. Gov't debt'. The September 10 Yr. U.S. Treasury Note stood at a yield of 2.2590% and the 30 Yr. U.S. Treasury Bond is yielding 2.8461%. 30 Year Mortgages according to Freddie Mac were around 4.03% for conforming and 4.09% for Jumbo products.
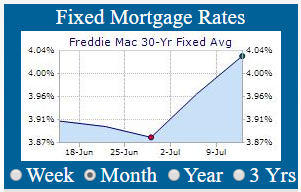
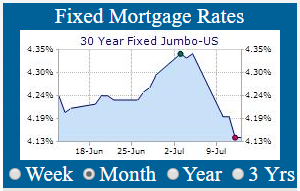
Housing Permits rose 7.4% in June after a terrible print in both April and May. Building Permits rose for both Single-Family and Multi-Family Units in June to 1,254,000 units (SAAR).
Housing Permits Rose 7.4% MoM (Chart courtesy of Zerohedge.com).
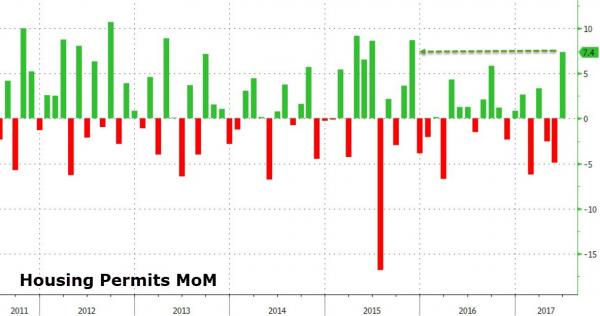
"Our members are telling us they are growing increasingly concerned over rising material prices, particularly lumber." said NAHB Chairman Granger MacDonald, a home builder and developer from Kerrville, Texas. "This is hurting housing affordability even as consumer interest in the new-home market remains strong."
Housing Permits Rise for both Single-Family and Multi-Family Units to 1,254,000 (SAAR)
(Chart courtesy of Zerohedge.com).
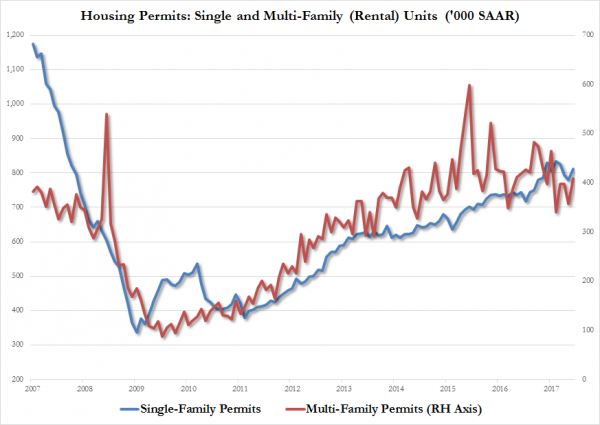
In June, Single-Family unit permits rose to 811,000 and Multi-Family permits rose to 443,000 units on a Seasonally Adjusted Annual Rate (SAAR).
Housing Starts Climb 8.3% MoM (Chart courtesy of Zerohedge.com).
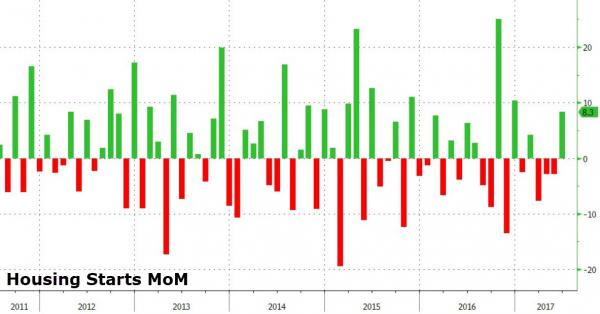
Meanwhile, Housing Starts in June also Rose by 8.3% overall showing continued consumer interest in the new-home market.
Housing Starts Rise for both Single-Family and Multi-Family Units to 1,215,000 (SAAR)
(Chart courtesy of Zerohedge.com).
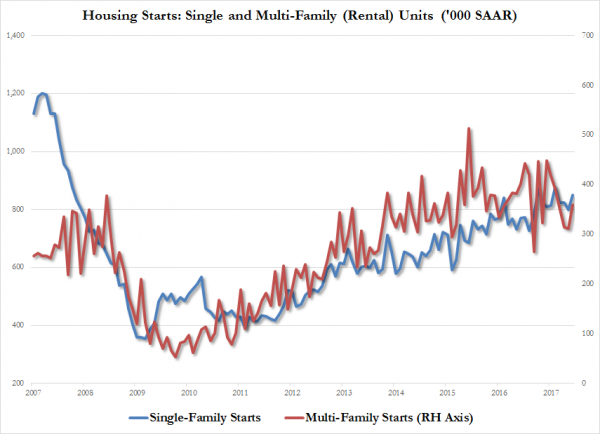
In June, Single-Family unit starts rose to 849,000 and Multi-Family starts rose to 366,000 units on a Seasonally Adjusted Annual Rate (SAAR).
Privately-owned housing completions in June were at a seasonally adjusted annual rate of 1,203,000, 5.2% above the revised May estimate of 1,144,000 and is 8.1% above the June 2016 rate of 1,113,000. Single-family housing completions in June were largely flat (+0.4%) at a rate of 798,000.
10 Year U.S. Treasury Note Yield Falls to 2.2625%
(Chart courtesy of Zerohedge.com).
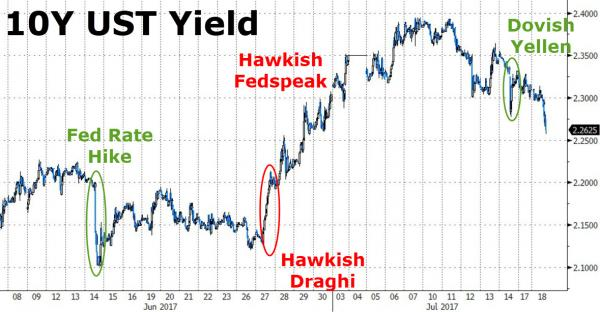
Here is a longer timeframe view of the 10 Yr. Treasury Note yield…
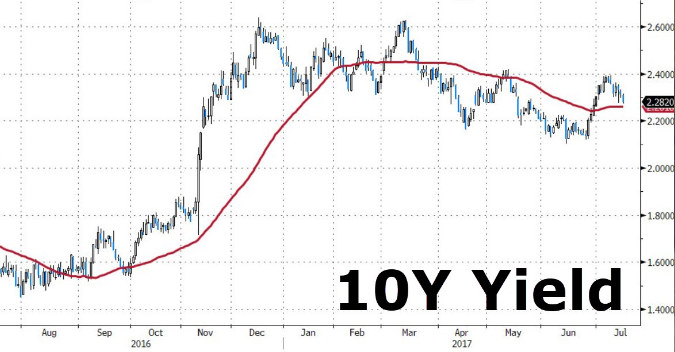
The above Chart does suggest that a constructive set-up is forming in the 10 Year Treasury Note with the potential to push the yield to around 2.00% over the next few weeks. As Congress turns its attention to negotiations regarding the raisin of the Debt-Ceiling and U.S. Government finances once again. It is crucial that Mortgage Rates stay at or below 4.00% or demand for mortgage loans will dry up. The window of opportunity for borrowers seeking mortgage refinancing & home purchases is still open for now, but for how long?
Weekly Mortgage Rates Analysis
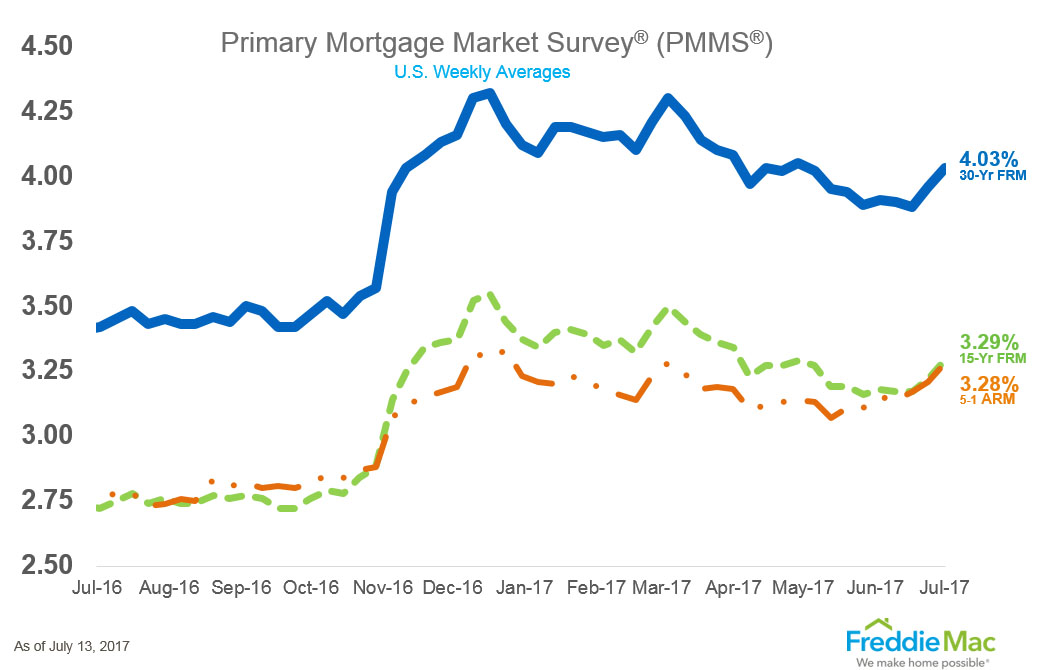
As can be seen from Freddie Mac's Mortgage Market Survey, last week, 30 Yr. Fixed Mortgage rates for conforming loans hit 4.03% rising another 0.07% basis points from the previous week.
Treasury Prices Rise and Yields Fall for U.S. 10 Yr. and 30 Yr. Treasuries.
At the Chicago Board of Trade (CBOT): the US 10 Year Treasury Note futures Contract for September settlement closed at a price of 126'03.5 / 32nds; the 10 Year Note was up 11.5 basis points (bps) on the day, yielding 2.2590%. The US 30 Year Treasury Bond futures Contract for Sept. settlement closed at a price of 153'27 / 32nds; the 30 Year Bond was up 31 basis points (bps) on the day, yielding 2.8461%. Mortgage Rates have come off their 2017 lows and are up 0.07% bps from the previous Freddie Mac Survey last week.
Thanks to ZeroHedge.com and FreddieMac.com for Charts and Graphics.
ERATE's Daily Rate Summary
July 18, 2017
Mortgage Rates and Treasury Yields Fall.
On Monday, Treasury bond yields and Mortgage interest rates fell as the credit market contemplates Fed Chairman, Janet Yellen words to Congress. So far, the market is fixated on the meaning of interest rate 'Neutrality'; but hasn't taken to heart her other words about the unsustainability of the 'trajectory of gov't debt'. The September 10 Yr. U.S. Treasury Note stood at a yield of 2.3141% and the 30 Yr. U.S. Treasury Bond is yielding 2.9039%. 30 Year Mortgages according to Freddie Mac were around 4.03% for conforming and 4.14% for Jumbo products.
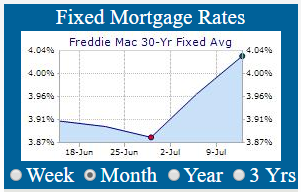
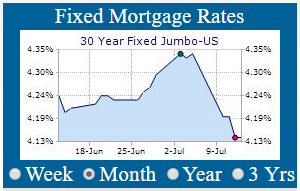
It appears that again everything is clear as mud with regard to Fed Policy and the future path of interest rates. So much so that the always confident Homebuilder Index tumbled to 2017 lows in its latest report. Builder confidence fell two points in July to its lowest reading since November 2016. Present single-family sales falls to 70 vs 72 last month. Future single-family sales falls to 73 vs 75 last month. Prospective buyers traffic falls to 48 vs 49 last month and the Fed.
NAHB Chief Economist Robert Dietz cautioned, "builders will need to manage some increasing supply-side costs to keep home prices competitive." Affordability!
Homebuilder Confidence Index Falls to 64 (Chart courtesy of Zerohedge.com).
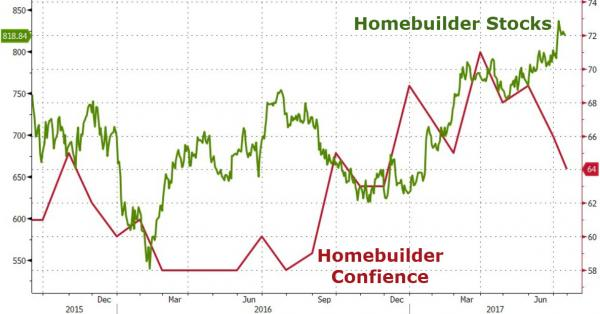
The 10 Year U.S. Treasury Note has now fallen to 2.2625% below its' 10 day moving average at 2.281%. Mortgage rates are set to improve again after a very slow spring and early summer lull. The Fed Funds Rate will be 1.50% by the end of 2017 which indicates only one additional rate hike this year and then a transition to a new Chairman in February 2018.
10 Year U.S. Treasury Note Yield Falls to 2.2625%
(Chart courtesy of Zerohedge.com).
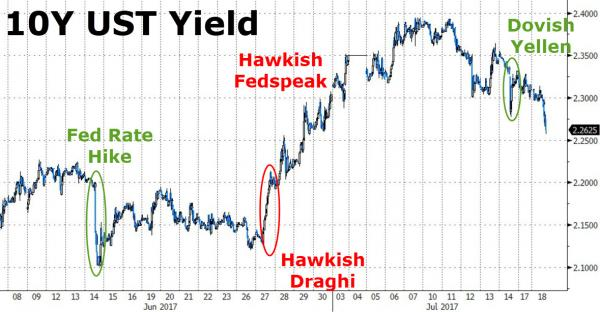
Here is a longer timeframe view of the 10 Yr. Treasury Note yield…
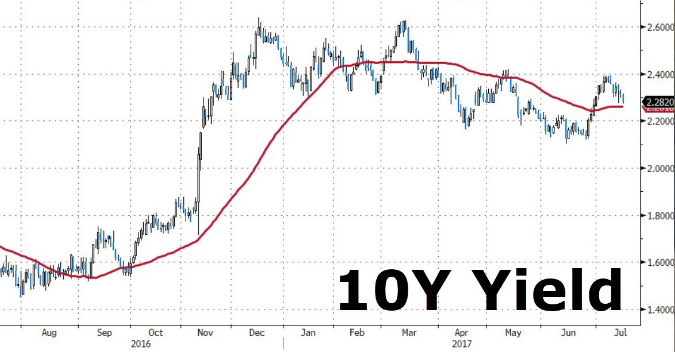
The above Chart does suggest that a constructive set-up is forming in the 10 Year Treasury Note with the potential to push the yield to around 2.00% over the next few weeks given that the focus will now turn to Congressional negotiations regarding the raisin of the Debt-Ceiling soon. This will be a volatile time for Credit Markets as attention points to U.S. Government (In-)Solvency once again. In my view, unless mortgage rates stay at or below these current levels, the banks know that demand for mortgage loans will dry up. The window of opportunity for borrowers seeking mortgage refinancing & home purchases is still open for now, but for how long?
December Rate-Hike Odds plunge to 42% (Chart courtesy of Zerohedge.com).
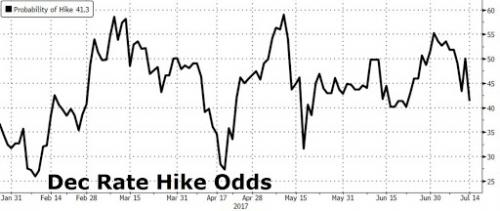
The Chart above shows that in the last few days the Odds of a December 2017 Rate-Hike have plunged from over 55% to near 40% levels.
The Mortgage Index shows very subdued volumes of Mortgage Refinance activity since the election in November 2016. Activity peaked last summer in early July with the Refi Mortgage Index hit 2900 and cratered after September to below 1200. The 4.00% 30 Yr. Mortgage Rate is a crucial threshold for Mortgage Refinance activity; hence the sensitivity when that level is breached.
Refinance Mortgage Index slumps to 1210 due to slight Rate Rise
(Chart courtesy of Zerohedge.com).
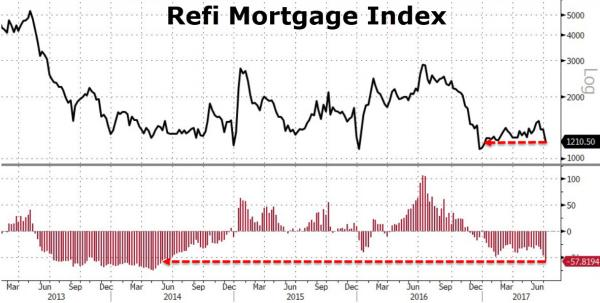
As can be seen from the above Chart, quantitatively small increases in the 10 Year U.S. Treasury Note can have an outsized impact on 30 Yr. Mortgage rates and significantly impact the volume of Mortgage Refi Applications in the pipeline as well as the overall Refinance Mortgage Index. Refinance borrowers are more rate sensitive than home purchasers as to the Mortgage interest rate they can get. If it doesn't help them lower their loan servicing costs they stop searching for refinances immediately…
Weekly Mortgage Rates Analysis
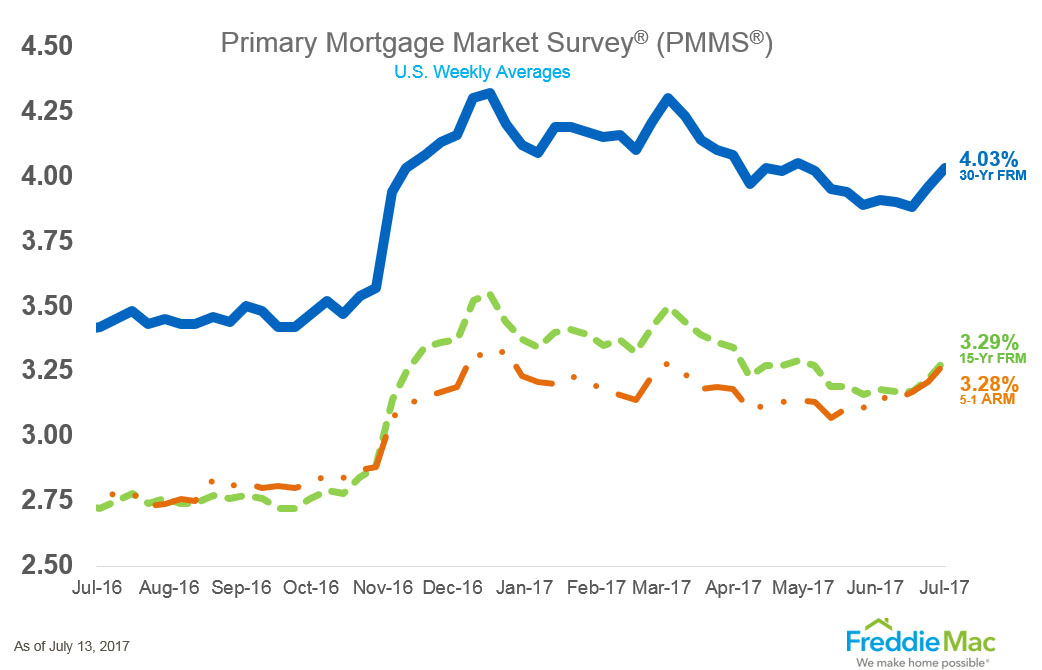
As can be seen from Freddie Mac's Mortgage Market Survey, last week, 30 Yr. Fixed Mortgage rates for conforming loans hit 4.03% rising another 0.07% basis points from the previous week.
Treasury Prices Rise and Yields Fall for U.S. 10 Yr. and 30 Yr. Treasuries.
At the Chicago Board of Trade (CBOT): the US 10 Year Treasury Note futures Contract for September settlement closed at a price of 125'24 / 32nds; the 10 Year Note was up 2.5 basis points (bps) on the day, yielding 2.3141%. The US 30 Year Treasury Bond futures Contract for Sept. settlement closed at a price of 152'28 / 32nds; the 30 Year Bond was up 8 basis points (bps) on the day, yielding 2.9039%. Mortgage Rates have come off their 2017 lows and are up 0.07% bps from the previous Freddie Mac Survey last week.
Thanks to ZeroHedge.com and FreddieMac.com for Charts and Graphics.
ERATE's Daily Rate Summary
July 17, 2017
Mortgage Rates and Treasury Yields Fall Modestly.
On Friday, Treasury bond yields and Mortgage interest rates fell modestly as credit markets digested Fed Chairman, Janet Yellen's remarks at her semi-annual testimony to Congress last week. The consensus is now a little muddled as to whether September or December will be the final rate hike in this tightening cycle. Should Janet Yellen be considered a ‘short-timer' in her position as the Fed Chairmen as her term is up in January 2018? Has she decided to sail off into the sunset without having to make the tough decision to significantly tighten Monetary conditions & take the punchbowl away just when the party was getting started.
The September 10 Yr. U.S. Treasury Note stood at a yield of 2.3319% and the 30 Yr. U.S. Treasury Bond is yielding 2.9195%. 30 Year Mortgages according to Freddie Mac were around 4.03% for conforming and 4.14% for Jumbo products.
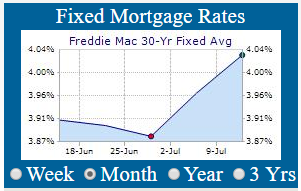
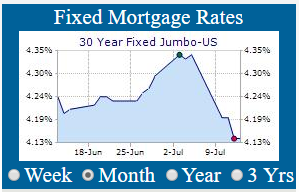
The multi-decade secular trend lower in Mortgage Rates has allowed U.S. Housing Prices to gently rise then accelerate via inflation from under $50k in 1980 to over $210k in 2017 (see chart below).
30-Year Mortgage Rates Vs. Home Prices (000s) (Real Investment Advice).
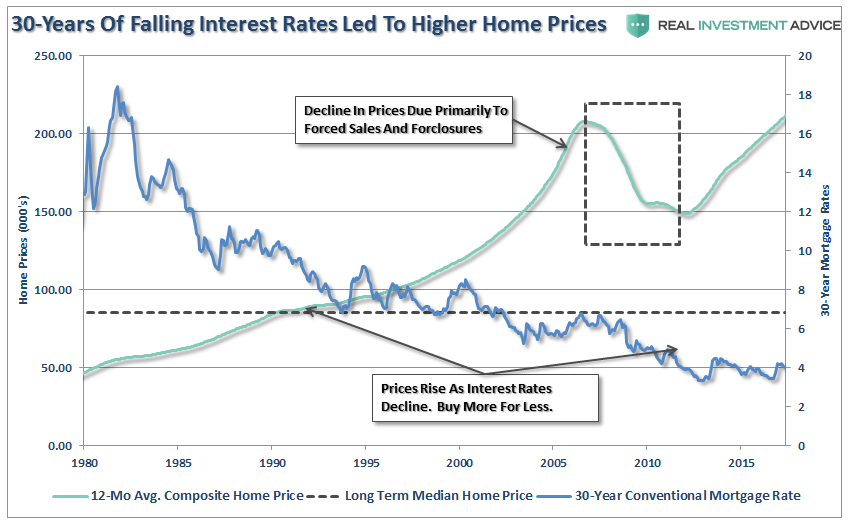
Because home borrowers for the most part buy a monthly mortgage payment and not a home price or interest rate, per se; widespread problems with housing un-affordability have been masked by a number of factors including: additional working spouse, greater levels of educational attainment, and general inflation in corporate SG&A (see chart below).
Mortgage Payment As % of Real Disposable Personal Income (DPI)
(Chart courtesy of Real Investment Advice).
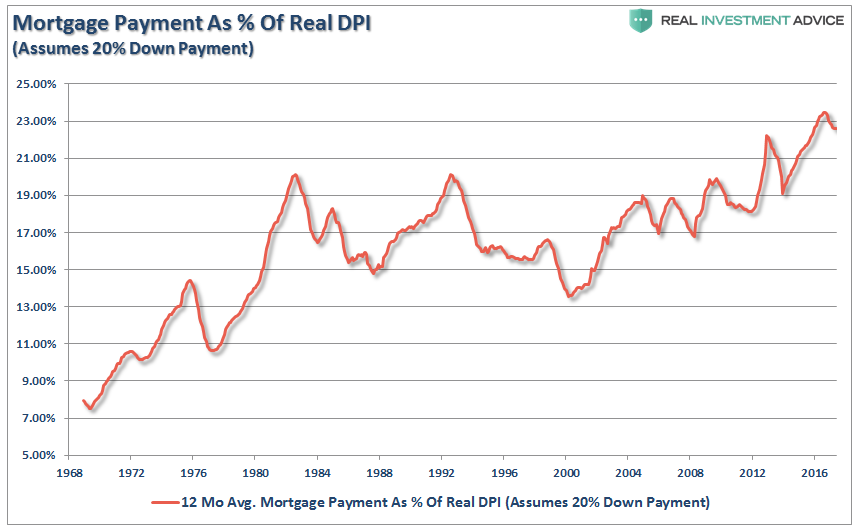
The Mortgage Payment as a percentage of Real Disposable Personal Income (DPI) has been in a stable range of 15% to 20% for decades. The addition of a working spouse helped us jump from the 7% to 15% of DPI levels in the 1970's. General inflation, Advance degrees and specialized training & skills (when in the past Businesses and Corporations were inclined to pay additional compensation for more highly skilled professional workforce) moved us along the path into the 2000's.
So, if I borrowed $50k at 16% in 1980, $100k at 8% 1995, and $200k at 4% in 2017 to buy a hypothetical home the amount of initial 1st year annual interest payments on those mortgages would be nearly equal at $8,000/year in the first crucial year of home ownership. The initial monthly payments during the amortization schedules are $673, $734, and $955/month. A stable though clearly inflationary financial dynamic is thus maintained; all due to the secular trend in Mortgage Interest rates (see Mortgage Calculator Results below).
Mortgage Calculator Results for Each Scenario (Courtesy of Erate.com).
The Mortgage Calculator results show that as the hypothetical Home appreciates fourfold in price between 1980 and 2017; the Secular trend lower in mortgage interest rates over that interval masks most of the erosion in home affordability (higher capital cost) and the mortgage payment only has risen from $672/month to $955/month in principal and interest (remember 1st year interest is still the exact same at $8,000).
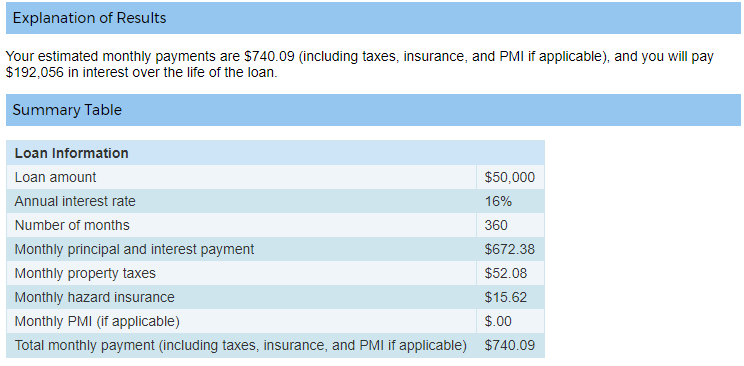
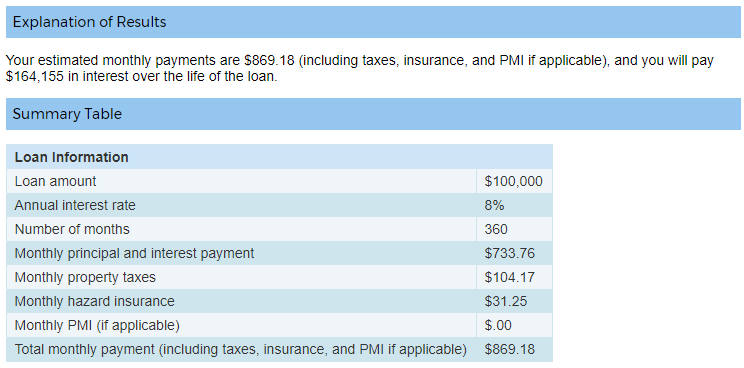
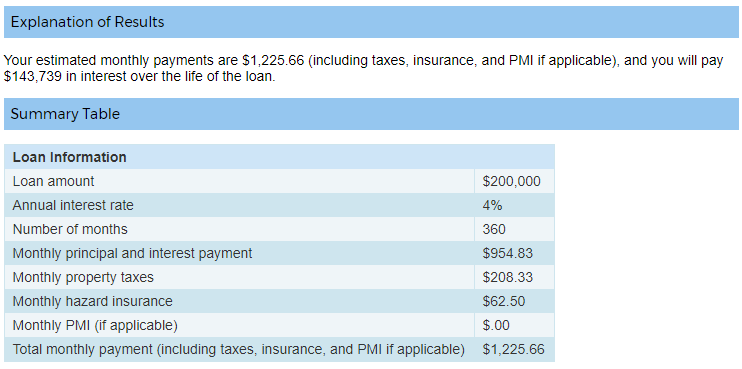
However, if instead mortgage rates now begin a secular increase from 4.00% in 2017 to 5% 2020, and then 6% in 2023 the math becomes very different and the stable dynamic disappears (unless businesses step up and increase Wages & Salaries consistently every year going forward).
As total interest & property taxes paid over the holding period balloons. The property tax problem is most acute because when you buy determines your fully capitalized cost of local government that your cohort is locked into paying (plus 2% per year increase see Prop. 13) and the inflation in the cost of local government has been and will continue to escalate at a rate far greater than inflation because politicians refuse to or can't deliver cost-improvements for the services rendered like private businesses and simply escalate their cost structures to infinity.
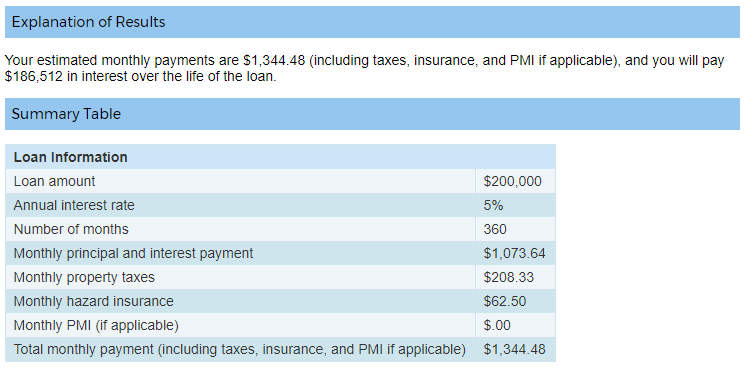
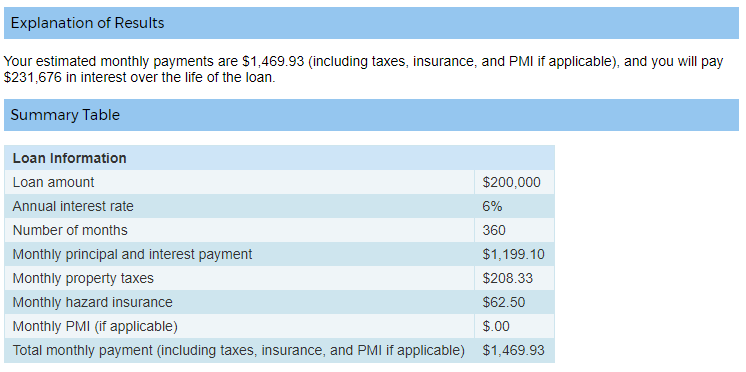
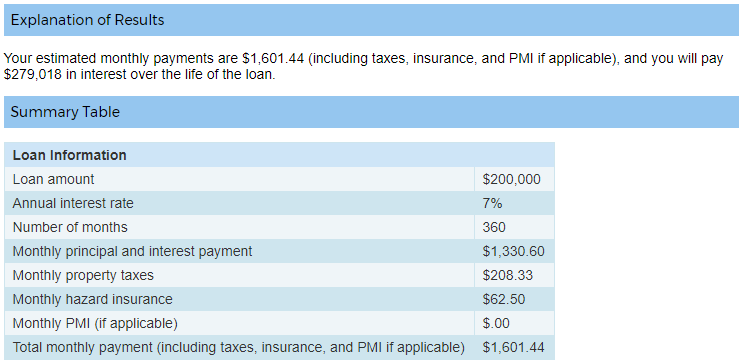
The scheme becomes untenable the higher property prices go so that you get a situation where a long-time owner who pays $2,000 a year in property taxes is sitting next to a recent owner who pays $12,000 a year in property taxes (Santa Clara County, CA) for neighbors with the exact same home.
The newer owner while nominally being able to afford the monthly mortgage payment is going to pay $300k in greater property taxes and $1.147m in greater mortgage interest than earlier owner over their lifetime of ownership and will receive the same level of local gov't services. This is Ponzi finance at its best.
There is a clear limit to how far this dynamic can be pushed and still find people who are willing to sacrifice home economics for ownership rights. In the Silicon Valley, the $200k home is now $1,200,000 and property taxes are $1,000/month. Would you sign on for this…
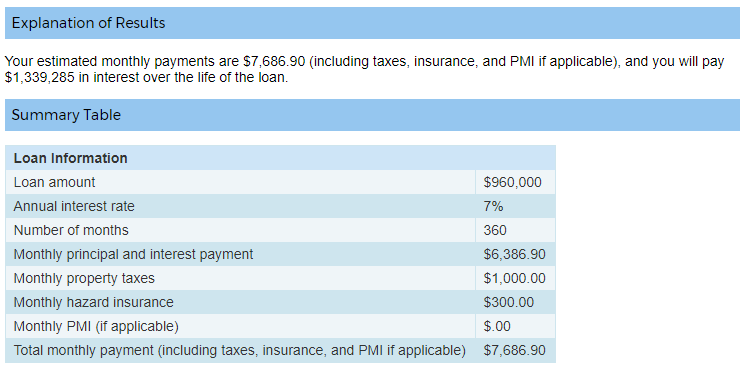
Unless you are a public-sector worker who just gamed the 80% of final year compensation formula give away with accrued vacation & overtime pay (sorry private sector employees); no one is going to be able to afford paying for these embedded cost structures and save for their own retirement & medical costs at these levels when mortgage interest rates normalize. Goodbye housing…
Weekly Mortgage Rates Analysis
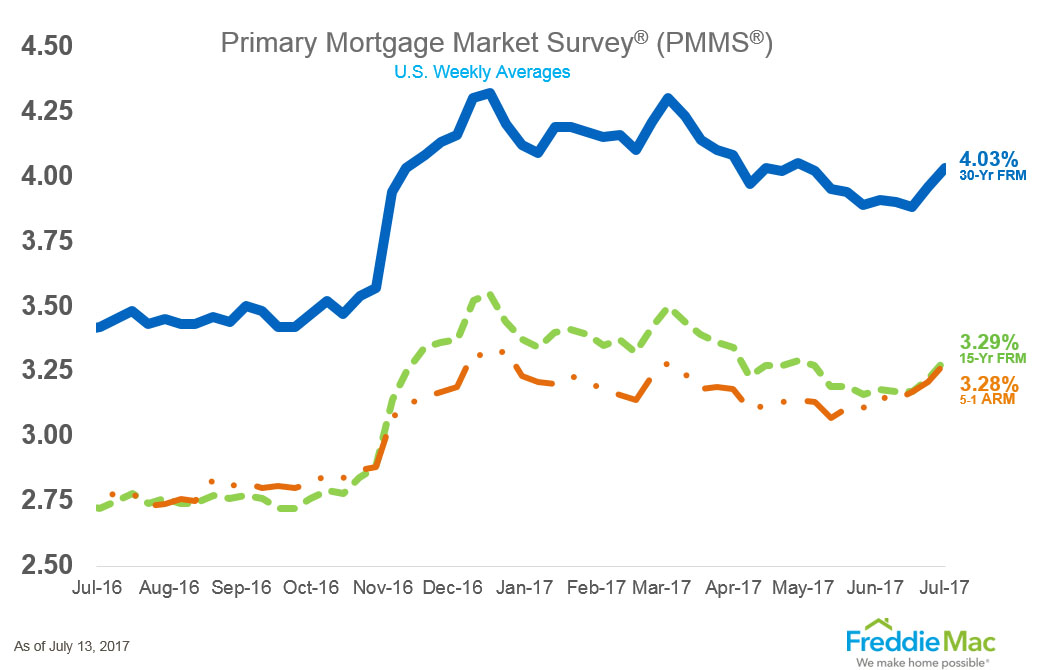
As can be seen from Freddie Mac's Mortgage Market Survey, last week, 30 Yr. Fixed Mortgage rates for conforming loans hit 4.03% rising another 0.07% basis points from the previous week.
Treasury Prices Rise and Yields Fall for U.S. 10 Yr. and 30 Yr. Treasuries.
At the Chicago Board of Trade (CBOT): the US 10 Year Treasury Note futures Contract for September settlement closed at a price of 125'21.5 / 32nds; the 10 Year Note was up 8.5 basis points (bps) on the day, yielding 2.3319%. The US 30 Year Treasury Bond futures Contract for Sept. settlement closed at a price of 152'20 / 32nds; the 30 Year Bond was up 14 basis points (bps) on the day, yielding 2.9195%. Mortgage Rates have come off their 2017 lows and are up 0.07% bps from the previous Freddie Mac Survey last week.
Thanks to Real Investment Advice, ZeroHedge.com and FreddieMac.com for Charts and Graphics.
ERATE's Daily Rate Summary
July 14, 2017
Mortgage Rates and Treasury Yields Rise Slightly.
On Thursday, Treasury bond yields rose and Mortgage interest rates were steady as Fed Chairman, Janet Yellen finished her semi-annual testimony to Congress. The always mercurial Yellen took an about-face ‘Dovish’ tone and hinted that inflation is running at 1.7% below the Fed’s 2% target and a “Neutral” rate target may be closer than we think. Quick, everyone to the other side of the boat!
It was a case of another Fed jawboned ‘perfect stick-save’ as both the stock market & bond market rebounded on the news this week. To remind our readers who haven’t been watching closely--Credit Markets are interpreting the Fed’s words to mean ‘rate pause’ in this tightening cycle (sooner rather than later), which is music to the captured market’s ears (i.e. “…we’re not serious about really tightening financial conditions”).
Reading between the lines of FedSpeak is the message--after 7 years at +0.25%, the Fed has only been able to raise the Fed Funds Rate 4 times to the present level of +1.25%, and will not complete it’s intended 11 rate hikes, like they said it would. The September 10 Yr. U.S. Treasury Note stood at a yield of 2.3444% and the 30 Yr. U.S. Treasury Bond is yielding 2.9172%. 30 Year Mortgages according to Freddie Mac were around 4.03% for conforming and 4.14% for Jumbo products.
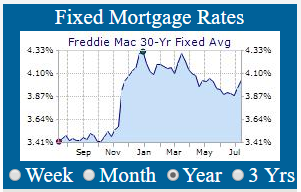
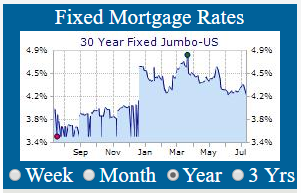
It appears that all the transparency & communication by The Fed to the markets about the Implied Fed Funds Target Rate path (the Dot Plot) is moot and they are back to ‘data dependent’ policy stance of renewed accommodation, according to Janet Yellen and the Fed.
Well, that was exactly what I suspected all along. Just as the Bank of Japan in August of 2000 attempted to normalize rates. Japan raised rates one-time from 0% to 0.25% causing term interest rates (2yr and 10yrs) to crater. The Bank of Japan then had to reverse course within 7 months and lower the rate back to 0.15% in February 2001.
Reminds me of The Vapors 1980 song lyrics, “Turning Japanese”. The Fed is cornered, it can’t raise rates by any significant amount to matter; because it will tank the economy & current interest rate at these emergency levels do not provide the Fed any policy room to ease should a recession start later this year. We’ve got trouble in River City!
Implied Fed Funds Target Rate (Dot Plot) (Chart courtesy of Zerohedge.com).
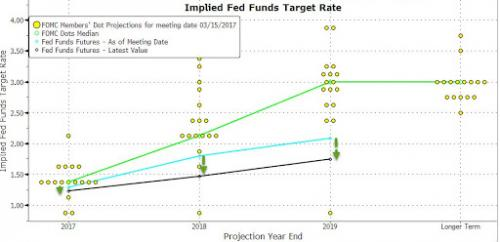
The now all-but-abandoned Federal Reserve Dot Plot suggests that the Fed Funds Rate will be 1.50% by the end of 2017 which indicated only one additional rate hike this year and two in 2018.
Federal Reserve Market-Implied Fed Tightening to End 2018
(Chart courtesy of Zerohedge.com).
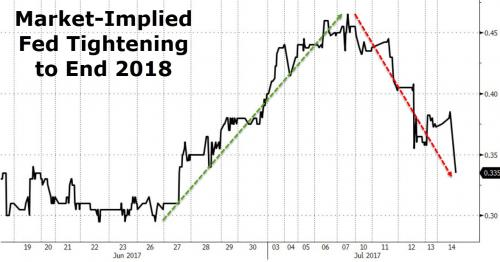
The new Market-Implied Fed Tightening to End of 2018 has just 0.335% bps of rate hikes (0.25% each) left until ‘Neutrality’ is reached (i.e. 1.34 rate moves). This has fallen recently from a path of a total of three (1 more in 2017 & 2 in 2018) three weeks ago. This highlights the behind the scenes seeming imperative by Creditors to keep the Mortgage market viable. It is my contention that unless mortgage rates stay at or below these current levels, demand for mortgage loans will dry up. The window of opportunity for borrowers seeking mortgage refinancing & home purchases is still open for now, but for how long?
December Rate-Hike Odds plunge to 42% (Chart courtesy of Zerohedge.com).
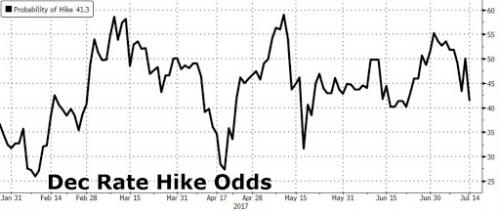
The Chart above shows that in the last few days the Odds of a December 2017 Rate-Hike have plunged from over 55% to near 40% levels.
The original Dot Plot path says seven more rate hikes (1.75% bps) in the next year and a half to end of 2019. It looks like we’ll be lucky to get one more rate hike before the Fed tells us that it is reversing course and lowering Fed Funds target back to emergency levels again.
The Mortgage Index shows very subdued volumes of Mortgage Refinance activity since the election in November 2016. Activity peaked last summer in early July with the Refi Mortgage Index hit 2900 and cratered after September to below 1200. The 4.00% 30 Yr. Mortgage Rate is a crucial threshold for Mortgage Refinance activity; hence the sensitivity when that level is breached.
Refinance Mortgage Index slumps to 1210 due to slight Rate Rise
(Chart courtesy of Zerohedge.com).
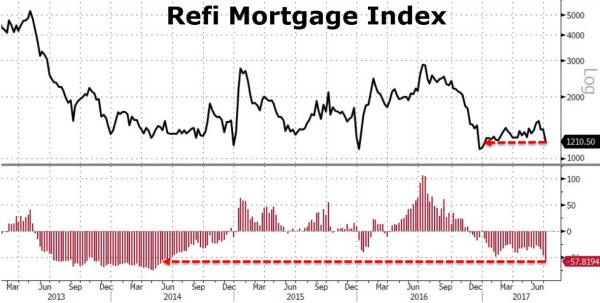
As can be seen from the above Chart, quantitatively small increases in the 10 Year U.S. Treasury Note can have an outsized impact on 30 Yr. Mortgage rates and significantly impact the volume of Mortgage Refi Applications in the pipeline as well as the overall Refinance Mortgage Index. Refinance borrowers are more rate sensitive than home purchasers as to the Mortgage interest rate they can get. If it doesn’t help them lower their loan servicing costs they stop searching for refinances immediately…
Weekly Mortgage Rates Analysis
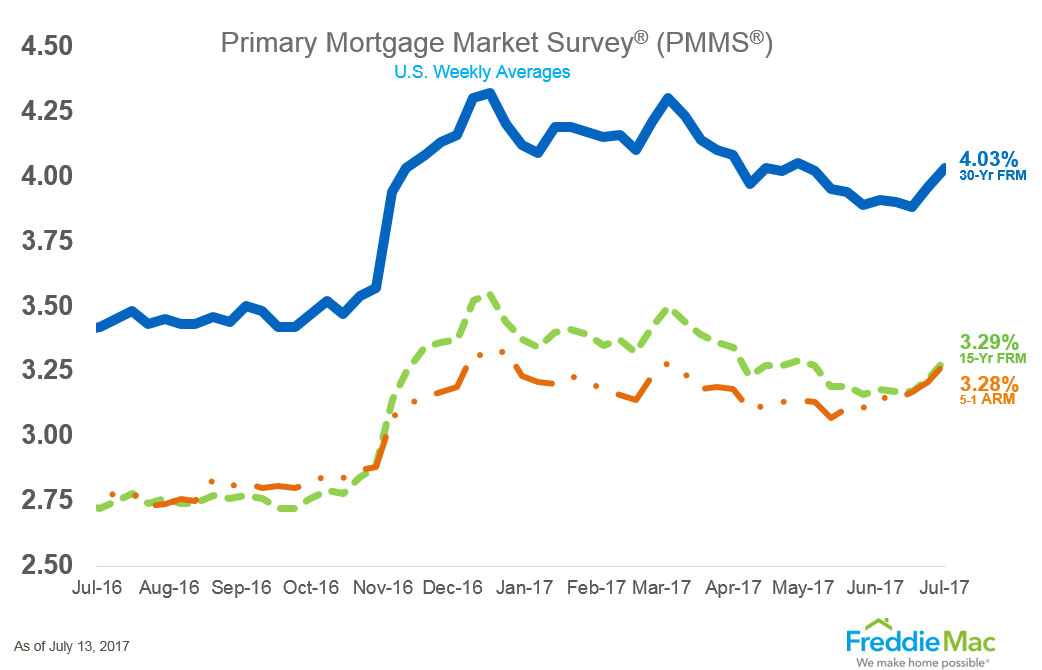
As can be seen from Freddie Mac’s Mortgage Market Survey, last week, 30 Yr. Fixed Mortgage rates for conforming loans hit 4.03% rising another 0.07% basis points from the previous week.
Treasury Prices Fall and Yields Rise for U.S. 10 Yr. and 30 Yr. Treasuries.
At the Chicago Board of Trade (CBOT): the US 10 Year Treasury Note futures Contract for September settlement closed at a price of 125’13 / 32nds; the 10 Year Note was down 3.5 basis points (bps) on the day, yielding 2.3444%. The US 30 Year Treasury Bond futures Contract for Sept. settlement closed at a price of 152’06 / 32nds; the 30 Year Bond was down 19 basis points (bps) on the day, yielding 2.9172%. Mortgage Rates have come off their 2017 lows and are up 0.07% bps from the previous Freddie Mac Survey last week.
Thanks to ZeroHedge.com and FreddieMac.com for Charts and Graphics.
ERATE's Daily Rate Summary
July 13, 2017
Mortgage Rates and Treasury Yields Fall.
On Wednesday, Treasury bonds yields fell and Mortgage interest rates eased as Fed Chairman, Janet Yellen told Congress that inflation is running below the 2% target and a "Neutral" rate target may be closer than we think. Success!
Consequently, Stocks soared on the news and Credit Markets heard the hint of 'rate pause' in a nascent rate hike cycle. After 7 years at +0.25%, the Fed Funds rate has been raised 4 times by 0.25% starting in Dec 2015 (after 100 basis points in total) to the present level of +1.25% in June 2017, and Interest Rate 'Neutrality' is close at hand. Forget about the Dot Plots Charts (see below) which were meticulously drawn & fawned over by the Chairman. Our Fed Champion Janet Yellen, like Roberto Duran; in the Leonard vs Duran Prizefight, is heard to utter; "No Mas!". The September 10 Yr. U.S. Treasury Note stood at a yield of 2.3177% and the 30 Yr. U.S. Treasury Bond is yielding 2.8838%. 30 Year Mortgages according to Freddie Mac were around 4.03% for conforming and 4.14% for Jumbo products.
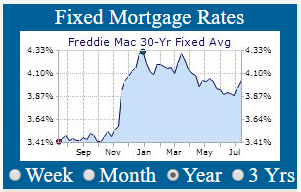
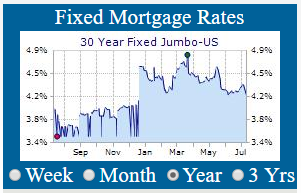
It appears that the meticulously constructed (by the Fed) Implied Fed Funds Target Rate (Dot Plot) is no longer the functional Interest Rate Path communication tool of standing anymore, according to the Fed. Well, that was a quickly aborted Fed Funds Rate Hike Cycle. Folks, to steal a quote from Walter Bagehot, a 19th-century editor of The Economist, expressing savers' traditional distaste for very low interest rates to Yellen; "JOHN BULL can stand many things but he cannot stand two per cent…" Folks, I hate to say it but, our economy has got serious problems beyond IR Policy!
Implied Fed Funds Target Rate (Dot Plot) (Chart courtesy of Zerohedge.com).
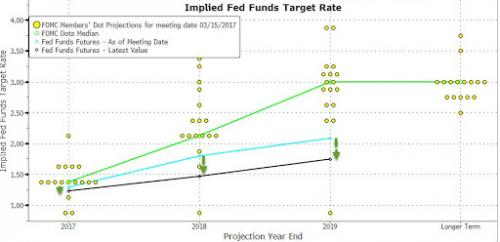
The now all-but-abandoned Federal Reserve Dot Plot suggests that the Fed Funds Rate will be 1.50% by the end of 2017 which indicated only one additional rate hike this year and two in 2018.
Federal Reserve Market Implied # of Rate Hikes for 2017 (Chart courtesy of Zerohedge.com).
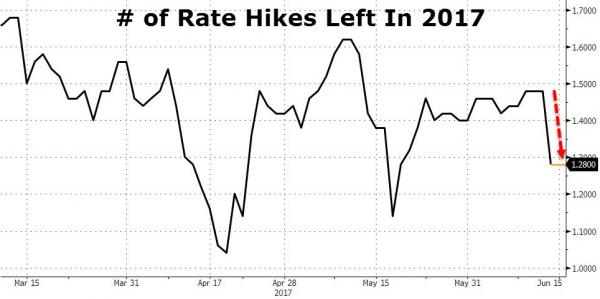
The Federal Reserve's current Market Implied # of Rate Hikes for 2017 has fallen recently to 1.28 from 1.50 three weeks ago. It is probably way lower now after Yellen's testimony, suggesting no further rate hikes may be needed this year to achieve 'Neutrality'. Supporting the view by Creditors that unless mortgage rates stay at or below these current levels, demand for mortgage loans will dry up. The window of opportunity for borrowers seeking mortgage refinancing & home purchases is still open for now, but for how long?
December Rate-Hike Odds plunge to 42% (Chart courtesy of Zerohedge.com).
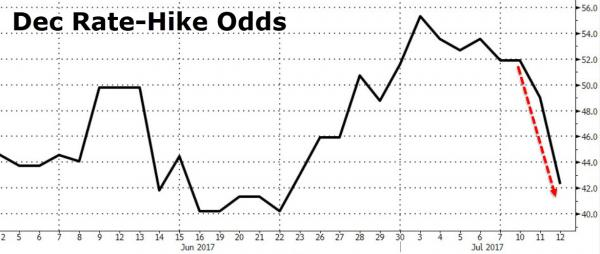
The Chart above shows that in the last few days the Odds of a December 2017 Rate-Hike have plunged from over 55% to below 40%, not.
The Dot Plot says seven more rate hikes in the next year and a half to end of 2019. It looks like we'll be lucky to get one more rate hike before the Fed tells us that it is reversing course and lowering Fed Funds target back to emergency levels again.
The Mortgage Index shows very subdued volumes of Mortgage Refinance activity since the election in November 2016. Activity peaked last summer in early July with the Refi Mortgage Index hit 2900 and cratered after September to below 1200. The 4.00% 30 Yr. Mortgage Rate is a crucial threshold for Mortgage Refinance activity; hence the sensitivity when that level is breached.
Refinance Mortgage Index slumps to 1210 due to slight Rate Rise
(Chart courtesy of Zerohedge.com).
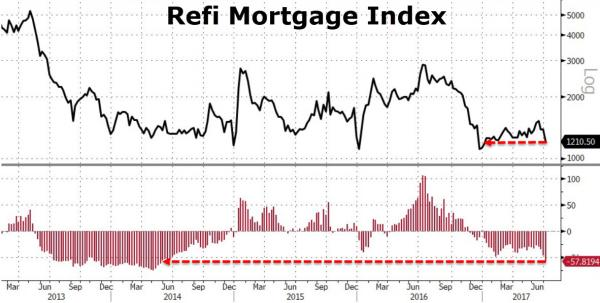
As can be seen from the above Chart, quantitatively small increases in the 10 Year U.S. Treasury Note can have an outsized impact on 30 Yr. Mortgage rates and significantly impact the volume of Mortgage Refi Applications in the pipeline as well as the overall Refinance Mortgage Index. Refinance borrowers are more rate sensitive than home purchasers as to the Mortgage interest rate they can get. If it doesn't help them lower their loan servicing costs they stop searching for refinances immediately…
Weekly Mortgage Rates Analysis
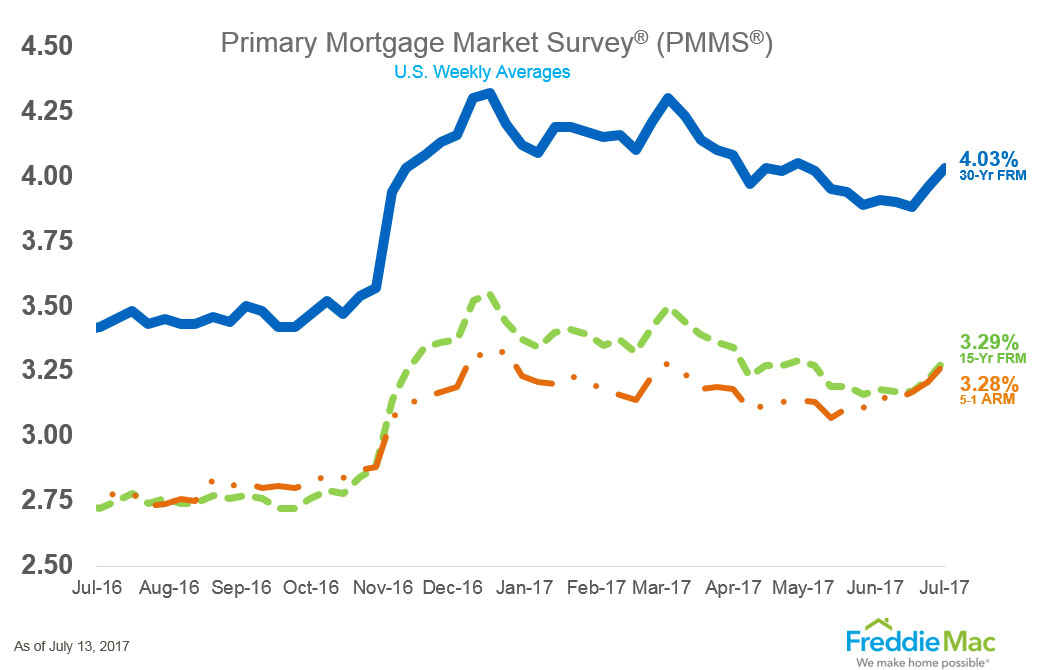
As can be seen from Freddie Mac's Mortgage Market Survey, last week, 30 Yr. Fixed Mortgage rates for conforming loans hit 4.03% rising another 0.07% basis points from the previous week.
Treasury Prices Rise and Yields Fall for U.S. 10 Yr. and 30 Yr. Treasuries.
At the Chicago Board of Trade (CBOT): the US 10 Year Treasury Note futures Contract for September settlement closed at a price of 125'16.5 / 32nds; the 10 Year Note was up 11 basis points (bps) on the day, yielding 2.3177%. The US 30 Year Treasury Bond futures Contract for Sept. settlement closed at a price of 152'25 / 32nds; the 30 Year Bond was up 23 basis points (bps) on the day, yielding 2.8838%. Mortgage Rates have come off their 2017 lows and are up 0.07% bps from the previous Freddie Mac Survey last week.
Thanks to ZeroHedge.com and FreddieMac.com for Charts and Graphics.
ERATE's Daily Rate Summary
July 12, 2017
Mortgage Rates and Treasury Yields Fall Modestly.
On Tuesday, Treasury bonds yields fell slightly and Mortgage interest rates eased as credit markets try to make sense of near-term Global Central Bank 'Normalization' policy. Mortgage Rates are mostly lower as pressure is brought to bear on Credit Markets as investors await Janet Yellen's testimony to Congress as to future interest rate policy. The September 10 Yr. U.S. Treasury Note stood at a yield of 2.3605% and the 30 Yr. U.S. Treasury Bond yielded 2.9234%. 30 Year Mortgages according to Freddie Mac were around 3.96% for conforming and 4.19% for Jumbo products.
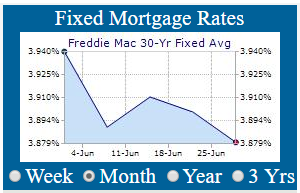
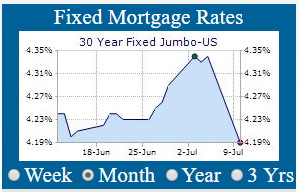
The Chart below (courtesy of Zerohedge.com) is a depiction of 30 Year Fixed Mortgage Rates (inv.) vs. Mortgage Applications. As 30 Yr. Mortgage rates started to come off the 2017 lows around 4.00% in late June toward 4.22%, the volume of Mortgage Applications fell -7.4% suggesting strong price/rate sensitivity on the part of would-be borrowers. Creditors understand that unless rates stay at or below these levels demand for mortgage loans will dry up. The window of opportunity for borrowers seeking mortgage refinancing & home purchases is still open for now, but for how long?
30 Yr. Mortgage Rate (inv.) vs Mortgage Applications (Chart courtesy of Zerohedge.com).
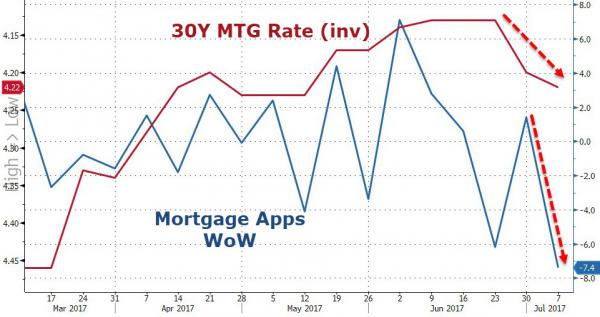
The Chart below is instructive. The Refinance Mortgage Index shows very subdued volumes of Mortgage Refinance activity since the election in November 2016. Activity peaked last summer in early July with the Refi Mortgage Index hit 2900 and cratered after September to below 1200. The 4.00% 30 Yr. Mortgage Rate is a crucial threshold for Mortgage Refinance activity; hence the sensitivity when that level is breached.
Refinance Mortgage Index slumps to 1210 due to slight Rate Rise
(Chart courtesy of Zerohedge.com).
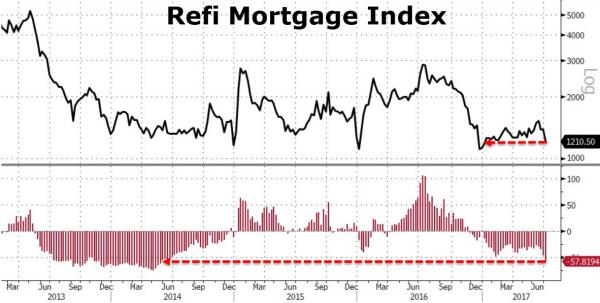
10 Yr. U.S. Treasury Note rises to 2.3445% (Chart courtesy of Zerohedge.com).
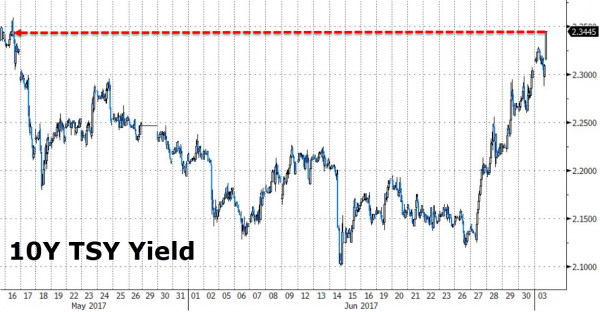
As can be seen from the above Chart, quantitatively small increases in the 10 Year U.S. Treasury Note can have an outsized impact on 30 Yr. Mortgage rates and significantly impact the volume of Mortgage Applications in the pipeline as well as the overall Refinance Mortgage Index. Refinance borrowers are more rate sensitive than home purchasers as to the Mortgage interest rate they can get. If it doesn't help them lower their loan servicing costs they stop searching for refinances immediately…
Weekly Mortgage Rates Analysis
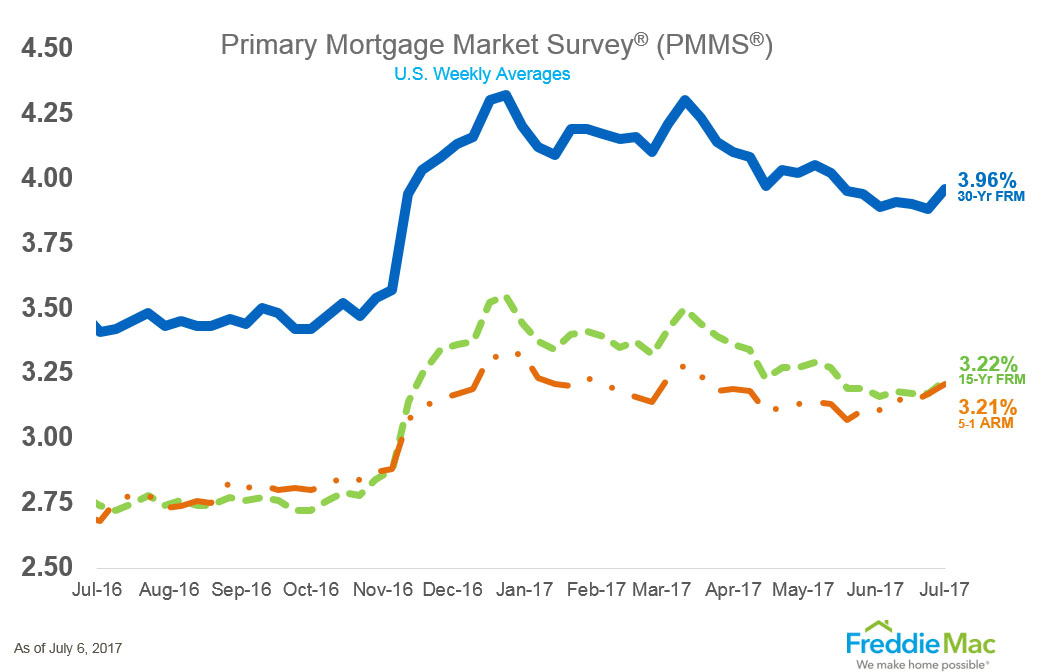
As can be seen from Freddie Mac's Mortgage Market Survey, last week, 30 Yr. Fixed Mortgage rates for conforming loans hit 3.96% rising 0.08% basis points from the previous week.
Treasury Prices Rise and Yields Fall for U.S. 10 Yr. and 30 Yr. Treasuries.
At the Chicago Board of Trade (CBOT): the US 10 Year Treasury Note futures Contract for September settlement closed at a price of 125'05.5 / 32nds; the 10 Year Note was up 3 basis points (bps) on the day, yielding 2.3605%. The US 30 Year Treasury Bond futures Contract for Sept. settlement closed at a price of 152'02 / 32nds; the 30 Year Bond was up 2 basis points (bps) on the day, yielding 2.9234%. Mortgage Rates have come off their 2017 lows and are up 0.08% bps from the previous Freddie Mac Survey last week.
Thanks to ZeroHedge.com and FreddieMac.com for Charts and Graphics.
ERATE's Daily Rate Summary
July 11, 2017
Mortgage Rates and Treasury Yields Fall Slightly.
On Monday, Treasury bonds yields fell modestly and Mortgage interest rates eased as credit markets try to make sense of near-term shift in Global Central Bank 'Hawkish' policy. Mortgage Rates are mostly steady as Creditors seek to make mortgage loans to fill an empty loan pipeline with borrowers who are still on-the-fence, but unknowingly staring at higher policy rates to come. The September 10 Yr. U.S. Treasury Note stood at a yield of 2.3730% and the 30 Yr. U.S. Treasury Bond yielded 2.9265%. 30 Year Mortgages according to Freddie Mac were around 3.96% for conforming and 4.34% for Jumbo products.
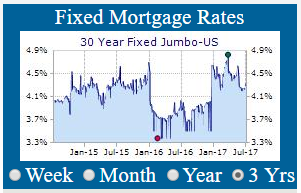
As can be seen from the Fixed Mortgage Rates Charts above, Mortgage rates are beginning to come off their 2017 lows and are still a good deal. The 3 Year Charts above show we are a long way from the Interest Rate lows of last summer, which was achieved by tricking Credit Markets into front-running the Global Central Bank coordinated easing, QE, and NIRP policies. It looks like this game is over for now. The window of opportunity for borrowers seeking mortgage refinancing & home purchases is still open for now, but for how long?
U.S. 30 Yr. Treasury Yield rises to 2.9297% (Chart courtesy of Zerohedge.com).
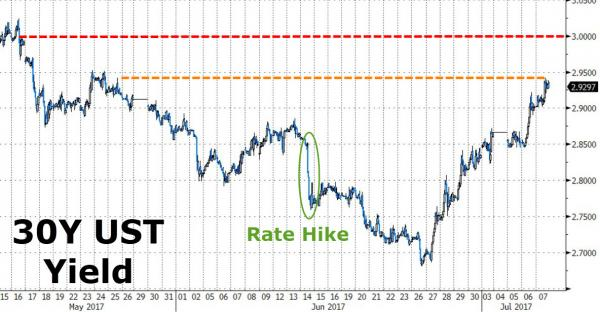
The 30 Yr. U.S. Treasury Bond is moving into a range between 2.95% and 3.00%. The 10 Yr. U.S. Treasury Note is following short term interest rates grudgingly higher toward a range of 2.45% and 2.50%. What happens after these ranges are breached will determine if Mortgage Rates can remain low or if credit conditions will be managed tighter by CB's in a coordinated movement in order to add ammo for easing when the next economic weakness cycle begins.
U.S. 10 Yr. Treasury Yield rises to 2.3445% (Chart courtesy of Zerohedge.com).
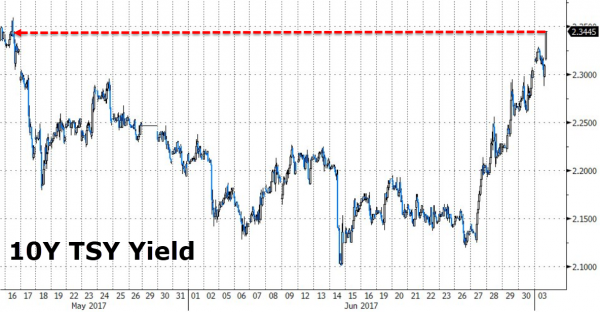
Total Global Debt Outstanding (all sectors) Hits $217 Trillion and 327% of World GDP
(Chart courtesy of IIF, BIS, Haver Analytics via Zerohedge.com).
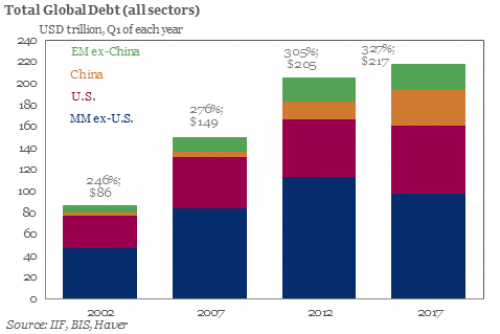
As can be seen from the above Chart the Total Global Debt Outstanding (all sectors) in Q1 2017 has just hit $217 Trillion or 327% of Worldwide GDP. The fundamental question remains: Can you solve a debt problem by adding on more debt? This is a giant Global problem. The narrative that the world can grow its way out of this problem is now strained and we are finding out that we are now constrained in our options. How this impasse resolves itself will determine what kind of economy we have for the next 20 years: deflationary (i.e. debt reduction/destruction/repudiation) or inflationary (i.e. debt increases/worldwide currency crises/more CB extraordinary measures/helicopter money). The key to the future is watching where the Fed member Banks are positioned. What the GFC taught us is the CB's will always protect the banking system and TBTF institutions as a last resort. Consumers will be left to pick up the pieces of their personal economy & standards of living…
Weekly Mortgage Rates Analysis
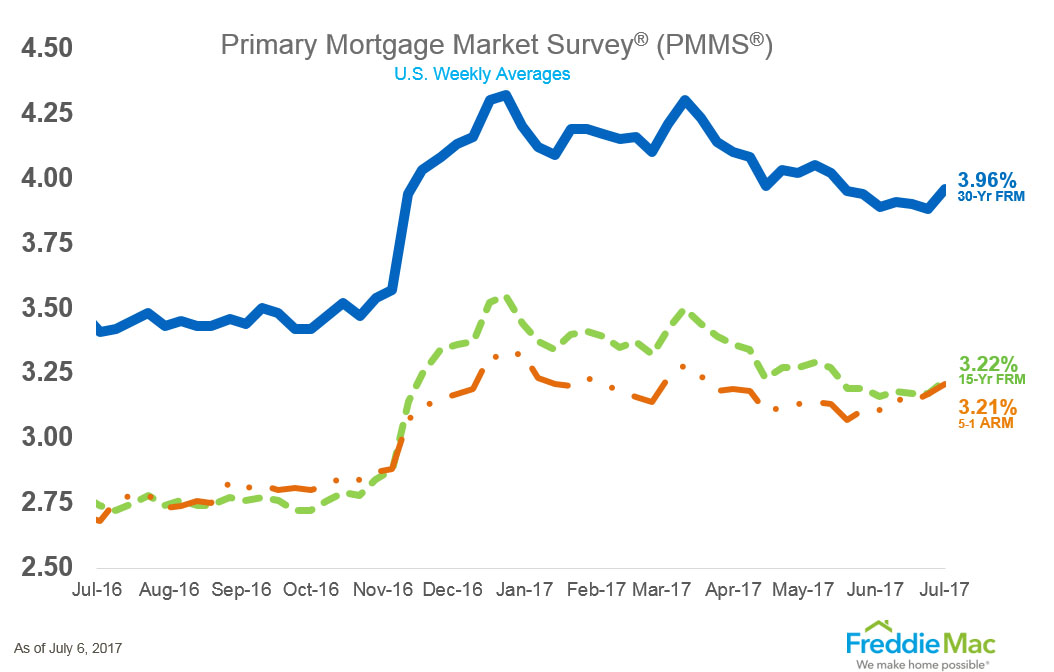
As can be seen from Freddie Mac's Mortgage Market Survey, last week, 30 Yr. Fixed Mortgage rates for conforming loans hit 3.96% rising 0.08% basis points from the previous week.
Treasury Prices Rise and Yields Fall for U.S. 10 Yr. and 30 Yr. Treasuries.
At the Chicago Board of Trade (CBOT): the US 10 Year Treasury Note futures Contract for September settlement closed at a price of 125'02.5 / 32nds; the 10 Year Note was up 7.5 basis points (bps) on the day, yielding 2.3730%. The US 30 Year Treasury Bond futures Contract for Sept. settlement closed at a price of 152'00 / 32nds; the 30 Year Bond was up 11 basis points (bps) on the day, yielding 2.9265%. Mortgage Rates have come off their 2017 lows and are up 0.08% bps from the previous Freddie Mac Survey last week.
Thanks to ZeroHedge.com, IIF, BIS, and Haver Analytics, and FreddieMac.com for Charts and Graphics.
ERATE's Daily Rate Summary
July 10, 2017
Mortgage Rates Rise Treasury Yields Climb.
On Friday, Treasury bonds yields rose and Mortgage interest rates ticked up again for a second day in a row due to ongoing Global Central Bank about-face on monetary policy normalization. Mortgage Rates are resisting impetus from the Credit Markets for a higher policy rate imposition. The September 10 Yr. U.S. Treasury Note stood at a yield of 2.3856% and the 30 Yr. U.S. Treasury Bond yielded 2.92896%. 30 Year Mortgages according to Freddie Mac were around 3.96% for conforming and 4.34% for Jumbo products.
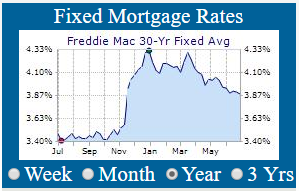
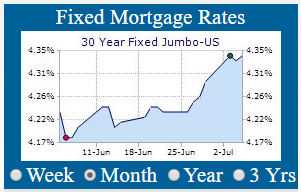
As can be seen from the Fixed Mortgage Rates Charts above, Mortgage rate are beginning to come off their 2017 lows and are still a good deal. The various Central Banks' are signaling a change in communication is now taking place; coalescing around the gradual increase narrative; despite the continued deterioration of the US Macro conditions. The window of opportunity for borrowers seeking mortgage refinancing & home purchases is still open for now, but for how long?
U.S. 30 Yr. Treasury Yield rises to 2.9297% (Chart courtesy of Zerohedge.com).
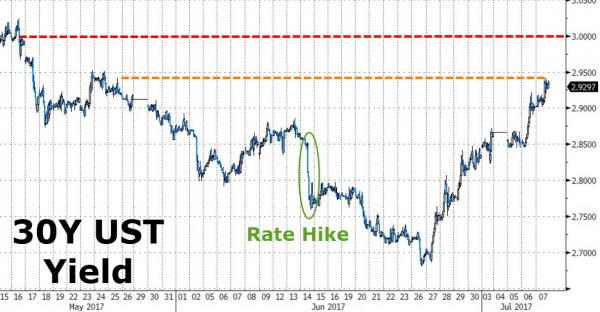
The 30 Yr. U.S. Treasury Bond is moving into a range between 2.95% and 3.00%. The 10 Yr. U.S. Treasury Note is following short term interest rates grudgingly higher toward a range of 2.45% and 2.50%. What happens after these ranges are breached will determine if Mortgage Rates can remain low or if credit conditions will be managed tighter by CB's in a coordinated movement in order to add ammo for easing when the next economic weakness cycle begins.
U.S. 10 Yr. Treasury Yield rises to 2.3445% (Chart courtesy of Zerohedge.com).
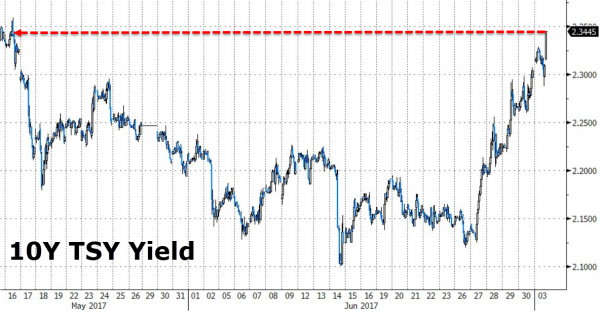
The Economic Events in the Week Ahead
(Chart courtesy of Zerohedge.com).
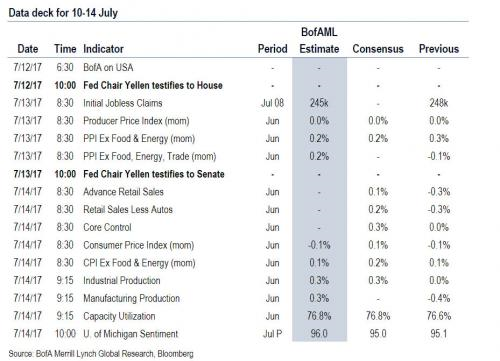
Summer doldrums have arrived. This week's Economic Calendar has some important Economic Releases, but none more important than Janet Yellen's Testimony to both branches of Congress on Wednesday & Thursday. However, keep in mind that as CB's begin to coordinate their narratives for tightening going forward in the face of a slowing economy fireworks could erupt at any time. A bad print in Initial Jobless Claims of unforeseen business layoffs could roil the markets for panic.
Weekly Mortgage Rates Analysis
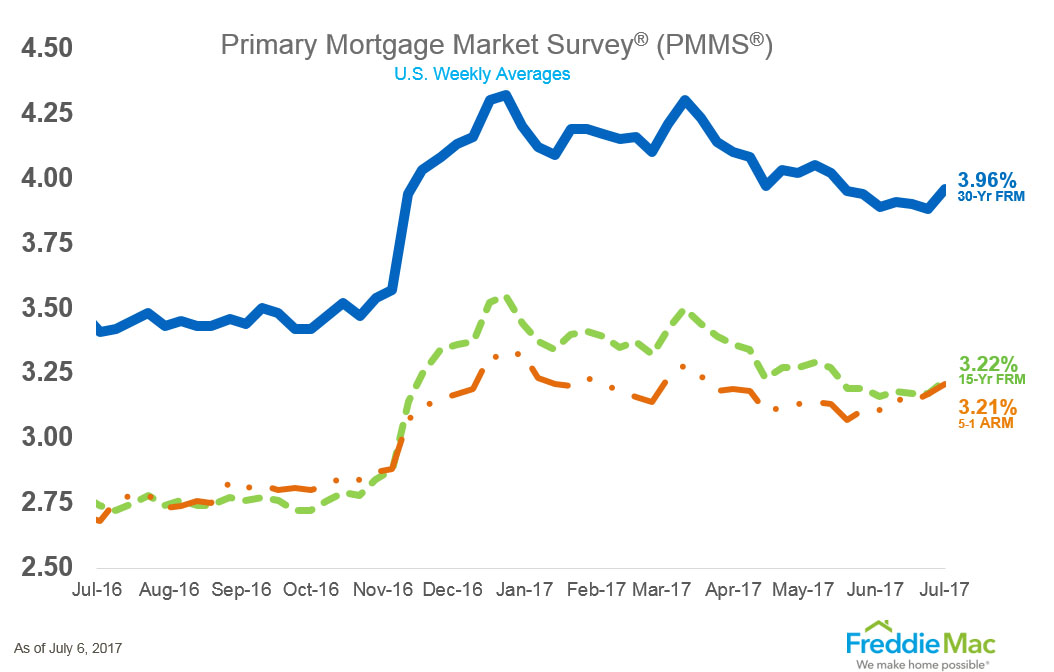
As can be seen from Freddie Mac's Mortgage Market Survey, last week, 30 Yr. Fixed Mortgage rates for conforming loans hit 3.96% rising 0.08% basis points from the previous week.
Treasury Prices Rise and Yields Fall for U.S. 10 Yr. and 30 Yr. Treasuries.
At the Chicago Board of Trade (CBOT): the US 10 Year Treasury Note futures Contract for September settlement closed at a price of 124'27 / 32nds; the 10 Year Note was down 4.5 basis points (bps) on the day, yielding 2.3856%. The US 30 Year Treasury Bond futures Contract for Sept. settlement closed at a price of 151'21 / 32nds; the 30 Year Bond was down 20 basis points (bps) on the day, yielding 2.9289%. Mortgage Rates have come off their 2017 lows and are up 0.08% bps from the previous Freddie Mac Survey last week.
Thanks to ZeroHedge.com, B of A Merrill Lynch Global Research, Bloomberg, and FreddieMac.com for Charts and Graphics.
ERATE's Daily Rate Summary
July 7, 2017
Mortgage Rates Rise Treasury Yields Climb.
On Thursday, Treasury bonds yields rose and Mortgage interest rates ticked up again for a second day in a row due to ongoing Global Central Bank about-face on monetary policy normalization. Mortgage Rates are resisting impetus from the Credit Markets for a higher policy rate imposition. The September 10 Yr. U.S. Treasury Note stood at a yield of 2.3659% and the 30 Yr. U.S. Treasury Bond yielded 2.9016%. 30 Year Mortgages according to Freddie Mac were around 3.96% for conforming and 4.34% for Jumbo products.
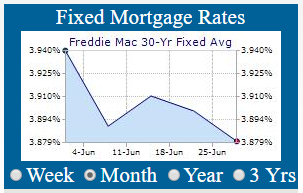
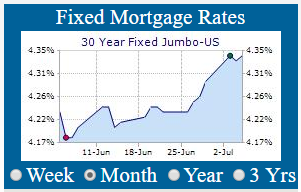
As can be seen from the Fixed Mortgage Rates Charts above, Mortgage rate are beginning to come off their 2017 lows and are still a good deal. The various Central Banks' are signaling a change in communication is now taking place; coalescing around the gradual increase narrative; despite the continued deterioration of the US Macro conditions. The window of opportunity for borrowers seeking mortgage refinancing & home purchases is still open for now, but for how long?
U.S. 30 Yr. Treasury Yield rises to 2.9375% (Chart courtesy of Zerohedge.com).
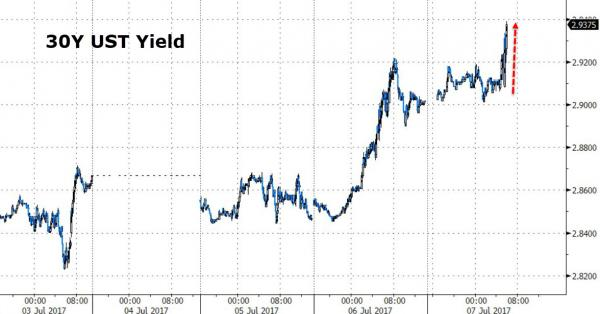
After a 'Hawkish' BLS Non-Farm Payroll Report which said that 222,000 in Jobs were created in June vs an expected 179,000 jobs. Both the 30 Yr. and 10 Yr. U.S. Treasury yields rose again to Mid- May levels. As displayed in the following Chart, the 10 Yr. Bond now stand just shy of 2.37% yield and is beginning to catch-up to where the 30 Yr. Bond is moving toward the 3.00% level.
U.S. 10 Yr. Treasury Yield rises to 2.3445% (Chart courtesy of Zerohedge.com).
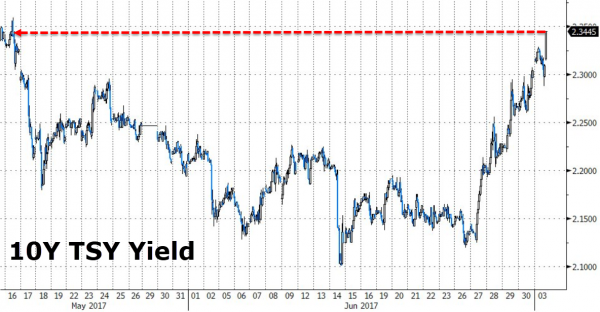
BLS Non-Farms Payroll for June created 222k Jobs Beats Expectations of 179k Jobs
(Chart courtesy of Zerohedge.com).
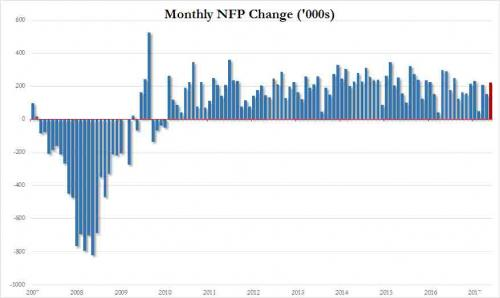
Labor Force Participation Rate is Stagnant at 62.8% and People not in the Labor Force static at 1978 levels with 94.813MM not working presently (Chart courtesy of Zerohedge.com).
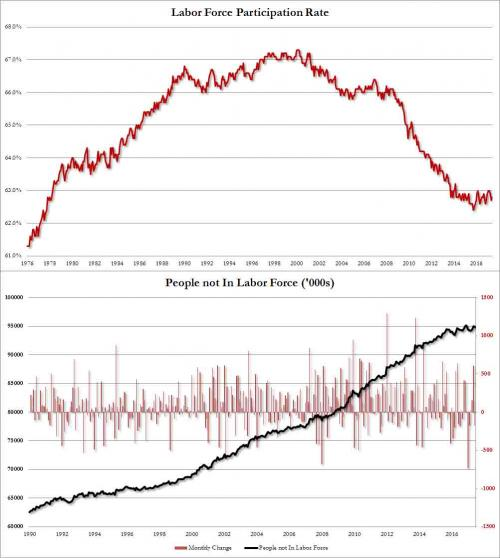
It appears that a hoped-for resurgence in people coming off the sidelines and back into the Labor force according to the BLS is not occurring (we are a 1978 Participation Levels) with 94.813 Million people of prime working age (25-54 yrs.) still not employed. This will eventually cause problems going forward both socially and economically (see chart above). This corresponding lack of income for spending & growth will haunt our economic future mightily (see next chart).
Average Weekly Earning Y/Y Change: All Workers and Average Hourly Earnings Y/Y And Monthly Change: All Workers (Charts courtesy of Zerohedge.com).
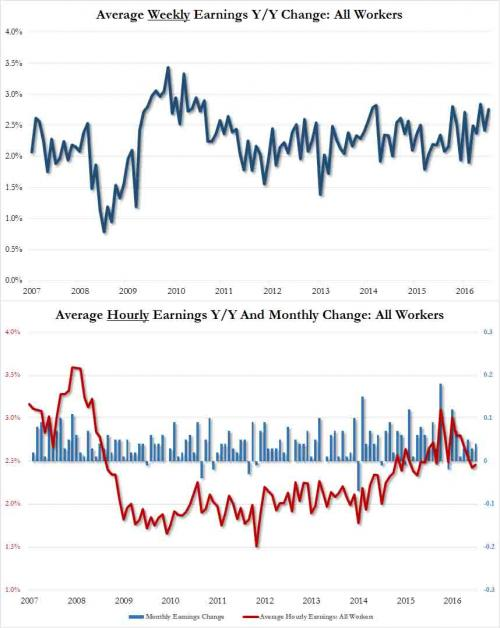
However, as Zerohedge.com reports; "the clear negative in today's report is that despite the better than expected job growth, wage growth once again disappointed, with average hourly earnings rising only 0.2% (technically 0.153%), missing expectations of a 0.3% increase, while the May earnings number was revised lower from 0.2% to 0.1%. On a Y/Y basis, avg. hourly earnings rose 2.5%, also missing expectations of a 2.6% increase." If we don't get wage growth at the bottom of the jobs pyramid, then we are going to eventually run out of spendable income to provide economic growth.
Weekly Mortgage Rates Analysis
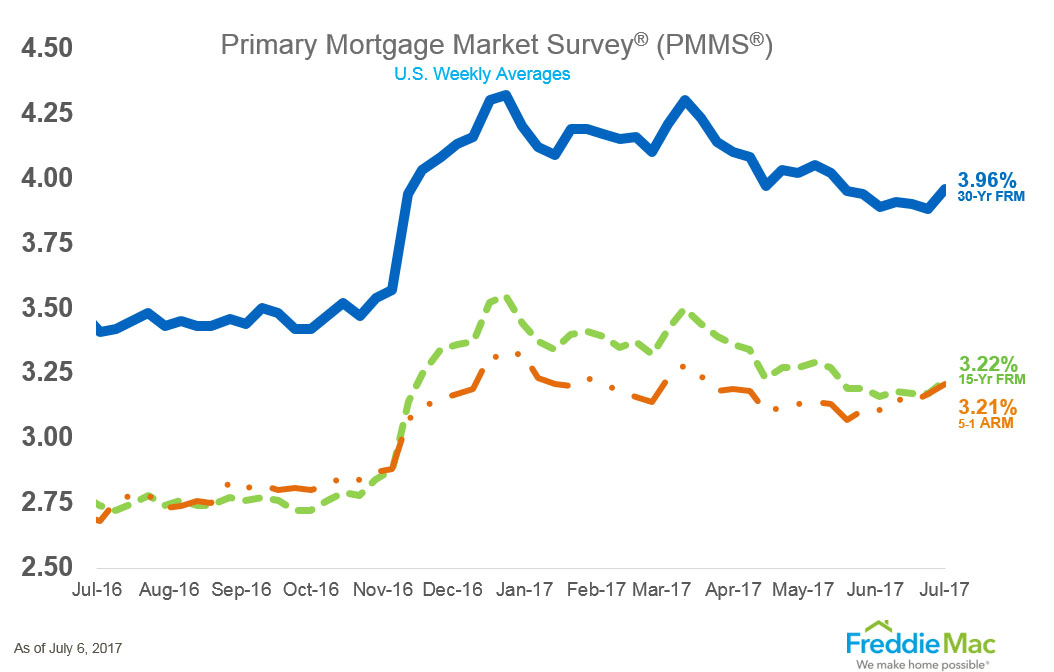
As can be seen from Freddie Mac's Mortgage Market Survey, last week, 30 Yr. Fixed Mortgage rates for conforming loans hit 3.96% rising 0.08% basis points from the previous week.
Treasury Prices Rise and Yields Fall for U.S. 10 Yr. and 30 Yr. Treasuries.
At the Chicago Board of Trade (CBOT): the US 10 Year Treasury Note futures Contract for September settlement closed at a price of 124'31.5 / 32nds; the 10 Year Note was down 7.5 basis points (bps) on the day, yielding 2.3659%. The US 30 Year Treasury Bond futures Contract for Sept. settlement closed at a price of 152'09 / 32nds; the 30 Year Bond was down 34 basis points (bps) on the day, yielding 2.9016%. Mortgage Rates have come off their 2017 lows and are up 0.08% bps from the previous Freddie Mac Survey last week.
Thanks to ZeroHedge.com and FreddieMac.com for Charts and Graphics.
ERATE's Daily Rate Summary
July 6, 2017
Mortgage Rates Unchanged Treasury Yields Pause.
On Wednesday, Treasury bond yields fell slightly and interest rates paused as consumers shy away from Retail Malls over holiday weekend. Mortgage Rates have moved ever so slowly off 2017 lows. The September 10 Yr. U.S. Treasury Note stood at a yield of 2.3232% and the 30 Yr. U.S. Treasury Bond yielded 2.8469%. 30 Year Mortgages according to Freddie Mac were around 3.96% for conforming and 4.34% for Jumbo products.
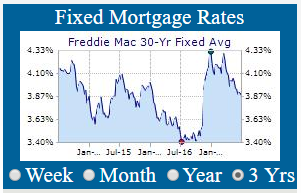
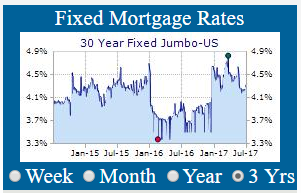
As can be seen from the 3 Year Fixed Mortgage Rates Charts above, we are still a long way from the lows of the Summer of last year. The trend is still down, but various Central Banks' communication is now coalescing around the gradual increase meme; despite continued deterioration of the US Macro Surprise Index. The window of opportunity for borrowers seeking mortgage refinancing & home purchases is still open for now, but for how long?
10 Year German Bund Yield rises to 0.551% (Chart courtesy of Zerohedge.com).
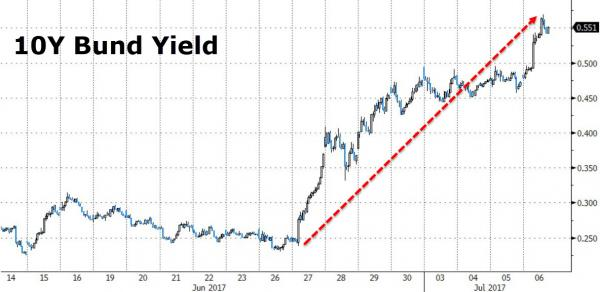
The German 10 Year Bund has continued its rise of the past few days and now stands at 0.551% after 'Hawkish' comments from ECB President Mario Draghi on Wednesday, 10 Year Bund yields rose dramatically (from just under 0.25% a week ago) to above late May levels.
10 Year Treasury Yields rises above 2.3784% again (Chart courtesy of Zerohedge.com).
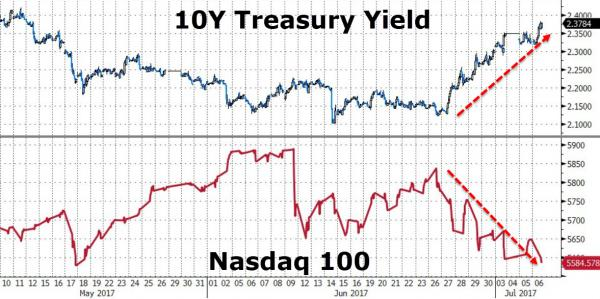
As displayed in the Chart, the U.S. 10 Year Treasury Note rose to a yield of 2.3784% and is closing in on the 2.42% high yield for May 2017.
U.S. 2 Yr. vs. 10 Yr. Treasury Yield Spread reverses higher to 97 bps from below 80 bps
(Chart courtesy of Zerohedge.com).
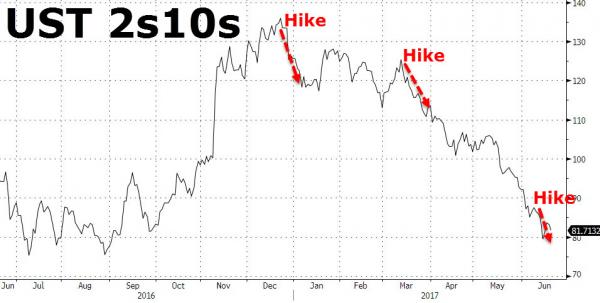
It appears that the trend since late December 2016 (the 2s10s spread) between short term U.S. Treasuries and longer-term Treasuries rates has now reversed higher after months of compression. This is an event that requires observation. As a move in the U.S. Treasury 2 Yr. vs 10 Yr. Yield Chart (see chart above); may presage higher Credit and Mortgage Rates to come this summer.
Implied Fed Funds Target Rate (Dot Plot) (Chart courtesy of Zerohedge.com).
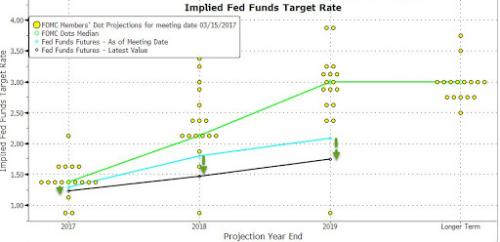
The so-called Dot Plot suggests that the Fed Funds Rate will be 1.50% by the end of 2017 which indicated only one additional rate hike this year and two in 2018.
Federal Reserve Market Implied # of Rate Hikes for 2017 (Chart courtesy of Zerohedge.com).
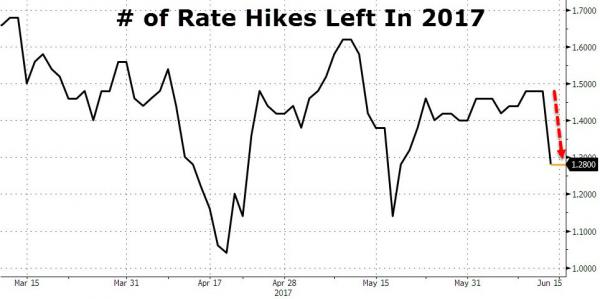
The Federal Reserve's current Market Implied # of Rate Hikes for 2017 has fallen recently to 1.28 from 1.50 three weeks ago; suggesting that macro-economic conditions are worsening somewhat recently and maybe not all the intended Fed Rate Hikes in 2017 (see dot plot) will happen.
Weekly Mortgage Rates Analysis
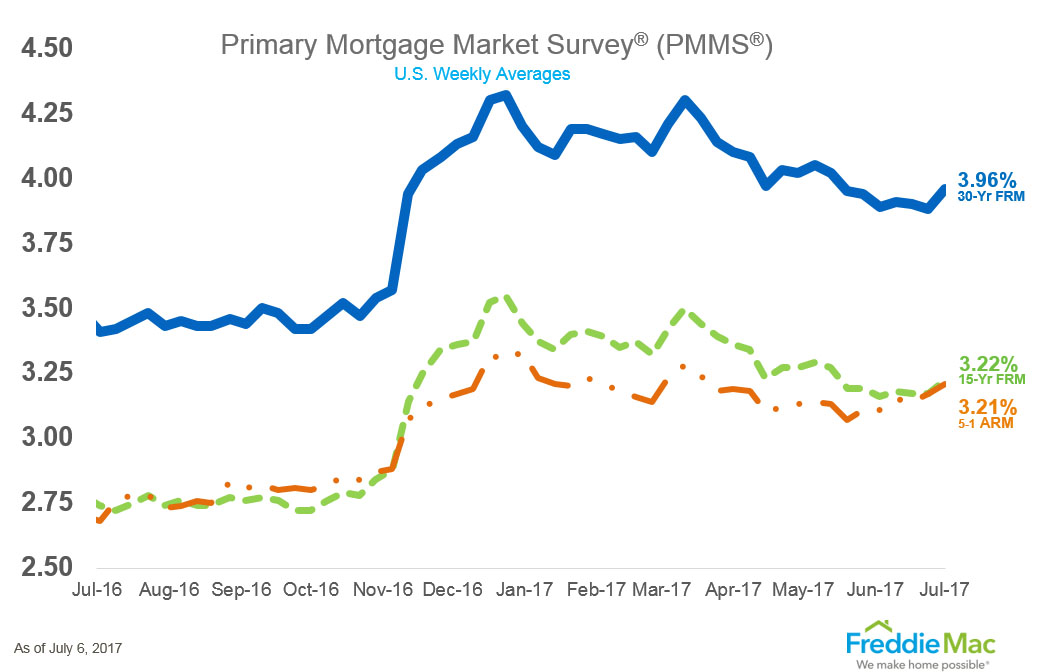
As can be seen from Freddie Mac's Mortgage Market Survey, last week, 30 Yr. Fixed Mortgage rates for conforming loans hit 3.96% moving higher by 0.08% basis points from last week.
Treasury Prices Rise and Yields Fall for U.S. 10 Yr. and 30 Yr. Treasuries.
At the Chicago Board of Trade (CBOT): the US 10 Year Treasury Note futures Contract for September settlement closed at a price of 125'07 / 32nds; the 10 Year Note was up 3.5 basis points (bps) on the day, yielding 2.3232%. The US 30 Year Treasury Bond futures Contract for Sept. settlement closed at a price of 153'11 / 32nds; the 30 Year Bond was up 9 basis points (bps) on the day, yielding 2.8469%. Mortgage Rates for now are holding at their 2017 lows and are down -0.02% bps from the previous Freddie Mac Survey last week.
Thanks to ZeroHedge.com and FreddieMac.com for Charts and Graphics.
ERATE's Daily Rate Summary
July 5, 2017
Mortgage Rates Rise Treasury Yields Climb.
On Monday, Treasury bonds yields rose and Mortgage interest rates followed, even though the dichotomy between 'Hard' and 'Soft' Data are signaling economic weakness ahead. Mortgage Rates are stubbornly moving off 2017 low yields as short-term Credit Market yields reprice higher. The September 10 Yr. U.S. Treasury Note stood at a yield of 2.3499% and the 30 Yr. U.S. Treasury Bond yielded 2.8669%. 30 Year Mortgages according to Freddie Mac were around 3.88% for conforming and 4.33% for Jumbo products.

As can be seen from the Fixed Mortgage Rates Charts above, Mortgage rate are beginning to come off their 2017 lows and are still a good deal. The various Central Banks' are signaling a change in communication is now taking place; coalescing around the gradual increase meme; despite continued deterioration of the US Macro Surprise Index. The window of opportunity for borrowers seeking mortgage refinancing & home purchases is still open for now, but for how long?
U.S. 10 Yr. Treasury Yield rises to 2.3445% (Chart courtesy of Zerohedge.com).
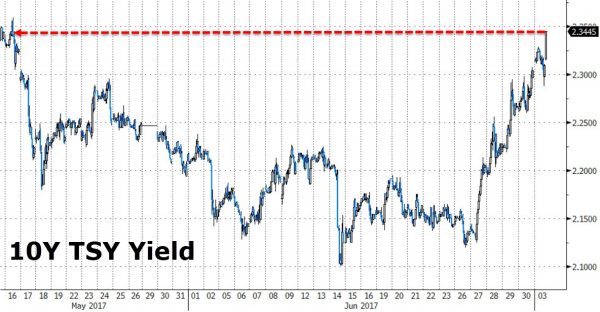
Central Banks have begun to communicate a more 'Hawkish' outlook for short term Interest Rate paths and are signaling to the markets that they may begin to curtail or remove further Credit Market quantitative easing & extreme liquidity measures later in the year.
In the last five days, U.S. 10 Yr. Treasury yields have risen strongly to Mid- May levels. As displayed in the following Chart, the so-called divergence between 'Soft' vs 'Hard' Data is continuing with the Factory Orders Index falling by -0.3% in May; demonstrating 'Hard' Data prints continue to languish at low levels.
Divergence Between 'Hard' and 'Soft' Data Signals Economic Weakness Ahead (Chart courtesy of Zerohedge.com).
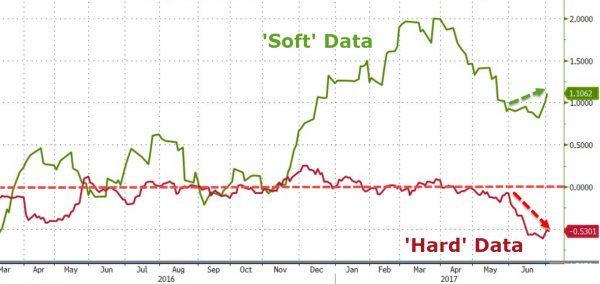
Factory Orders Index (Ex-Transportation Orders) MoM (Chart courtesy of Zerohedge.com).
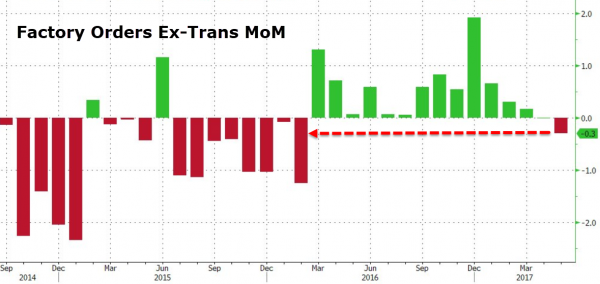
In May, Factory Orders (Ex-Transportation Orders) fell -0.3% from April levels ('Hard' Data) in a fresh sign that all is not well in the Manufacturing sector of the economy. We had a very weak Q1 in 2016, Factory Orders rebounded all throughout election year. Now comparisons are harder, and month-to-month is slipping again into continued economic weakness (see chart above). This may presage higher Credit and Mortgage Rates to come this summer, while we keep in mind the Federal Reserve's commitment to gradual Fed Funds rate increases this & next year.
Implied Fed Funds Target Rate (Dot Plot) (Chart courtesy of Zerohedge.com).
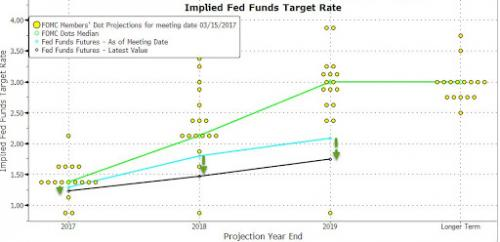
The so-called Dot Plot suggests that the Fed Funds Rate will be 1.50% by the end of 2017 which indicated only one additional rate hike this year and two in 2018.
Federal Reserve Market Implied # of Rate Hikes for 2017 (Chart courtesy of Zerohedge.com).
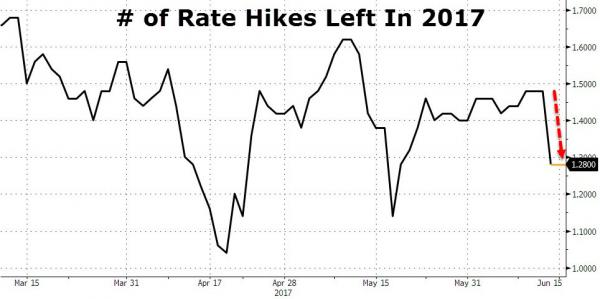
The Federal Reserve's current Market Implied # of Rate Hikes for 2017 has fallen recently to 1.28 from 1.50 three weeks ago; suggesting that macro-economic conditions are worsening somewhat recently and maybe not all the intended Fed Rate Hikes in 2017 (see dot plot) will happen.
Weekly Mortgage Rates Analysis
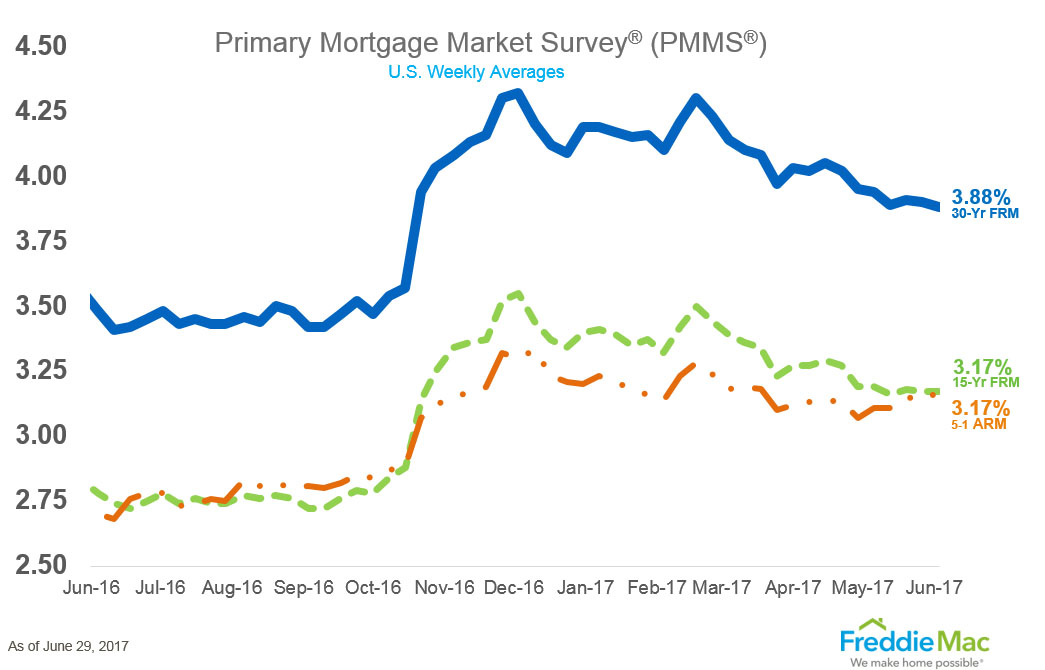
As can be seen from Freddie Mac's Mortgage Market Survey, last week, 30 Yr. Fixed Mortgage rates for conforming loans hit 3.88% sliding -0.02% basis points from last week.
Treasury Prices Fall and Yields Rise for U.S. 10 Yr. and 30 Yr. Treasuries.
At the Chicago Board of Trade (CBOT): the US 10 Year Treasury Note futures Contract for September settlement closed at a price of 125'03.5 / 32nds; the 10 Year Note was down 13.5 basis points (bps) on the day, yielding 2.3499%. The US 30 Year Treasury Bond futures Contract for Sept. settlement closed at a price of 153'02 / 32nds; the 30 Year Bond was down 20 basis points (bps) on the day, yielding 2.8669%. Mortgage Rates are now in a holding pattern just off their 2017 lows and are down -0.02% bps from the previous Freddie Mac Survey last week.
Thanks to ZeroHedge.com and FreddieMac.com for Charts and Graphics.
ERATE's Daily Rate Summary
July 3, 2017
Mortgage Rates Rise Treasury Yields Climb.
On Friday, Treasury bonds yields rose and Mortgage interest rates followed albeit tempered by a background of economic weakness in "Hard Data". Mortgage Rates grudgingly have followed the Credit Markets higher, so far. The September 10 Yr. U.S. Treasury Note stood at a yield of 2.3037% and the 30 Yr. U.S. Treasury Bond yielded 2.8348%. 30 Year Mortgages according to Freddie Mac were around 3.88% for conforming and 4.29% for Jumbo products.

As can be seen from the Fixed Mortgage Rates Charts above, Mortgage rate are beginning to come off their 2017 lows and are still a good deal. The various Central Banks' are signaling a change in communication is now taking place; coalescing around the gradual increase meme; despite continued deterioration of the US Macro Surprise Index. The window of opportunity for borrowers seeking mortgage refinancing & home purchases is still open for now, but for how long?
U.S. 10 Yr. Treasury Yield rises to 2.3445% (Chart courtesy of Zerohedge.com).
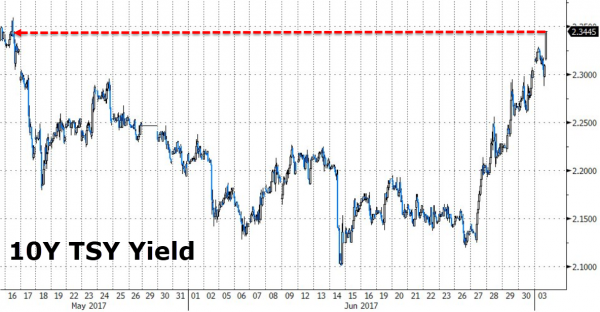
After 'Hawkish' comments from ECB President Mario Draghi on Wednesday, U.S. 10 Yr. Treasury yields have risen strongly to Mid- May levels. As displayed in the following Chart, the so-called Institute of Supply Management's Index rose strongly to a reading of 57.8 (anything above 50 connotes 'growth') while the Manufacturing PMI and 'Hard' Data continue to languish at low levels.
ISM Manufacturing Index Rises, PMI & 'Hard' Data Fall (Chart courtesy of Zerohedge.com).
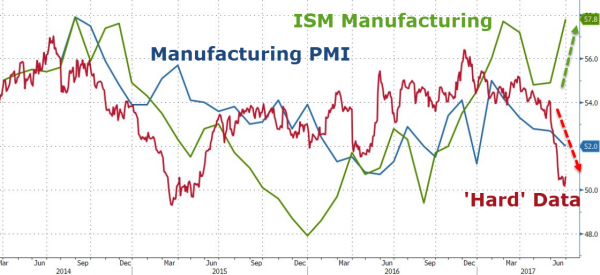
Key Components in ISM Manufacturing Index (Chart courtesy of Zerohedge.com).
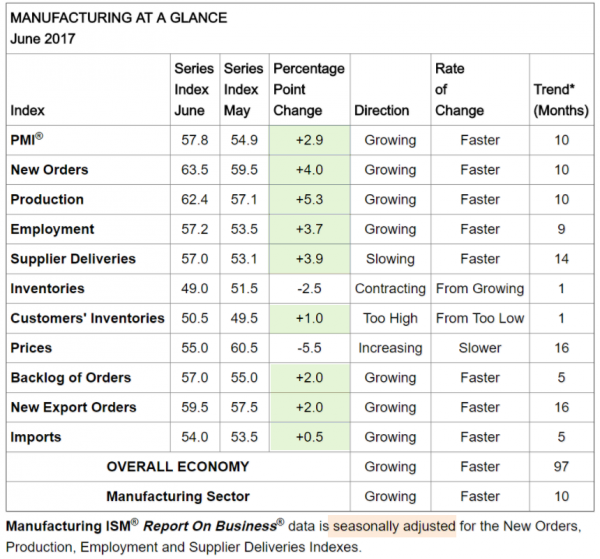
It appears that according to the ISM Manufacturing Index many components of the Manufacturing Sector are growing robustly. While only Inventories and Prices paid are negative (see chart above). This may presage higher Credit and Mortgage Rates to come this summer, while we keep in mind the Federal Reserve's commitment to gradual Fed Funds rate increases this & next year.
Implied Fed Funds Target Rate (Dot Plot) (Chart courtesy of Zerohedge.com).
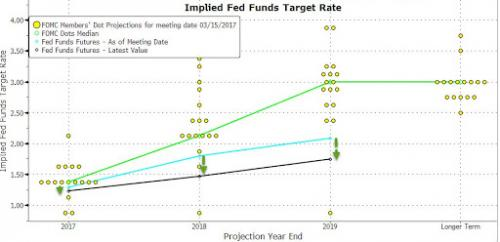
The so-called Dot Plot suggests that the Fed Funds Rate will be 1.50% by the end of 2017 which indicated only one additional rate hike this year and two in 2018.
Federal Reserve Market Implied # of Rate Hikes for 2017 (Chart courtesy of Zerohedge.com).
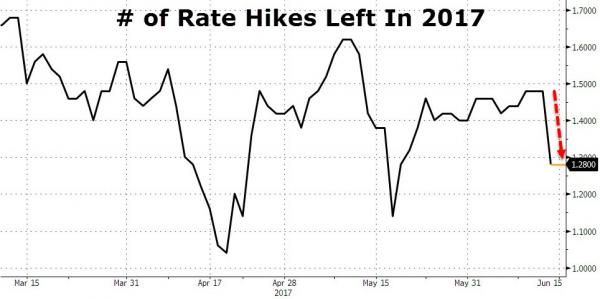
The Federal Reserve's current Market Implied # of Rate Hikes for 2017 has fallen recently to 1.28 from 1.50 three weeks ago; suggesting that macro-economic conditions are worsening somewhat recently and maybe not all the intended Fed Rate Hikes in 2017 (see dot plot) will happen.
Weekly Mortgage Rates Analysis
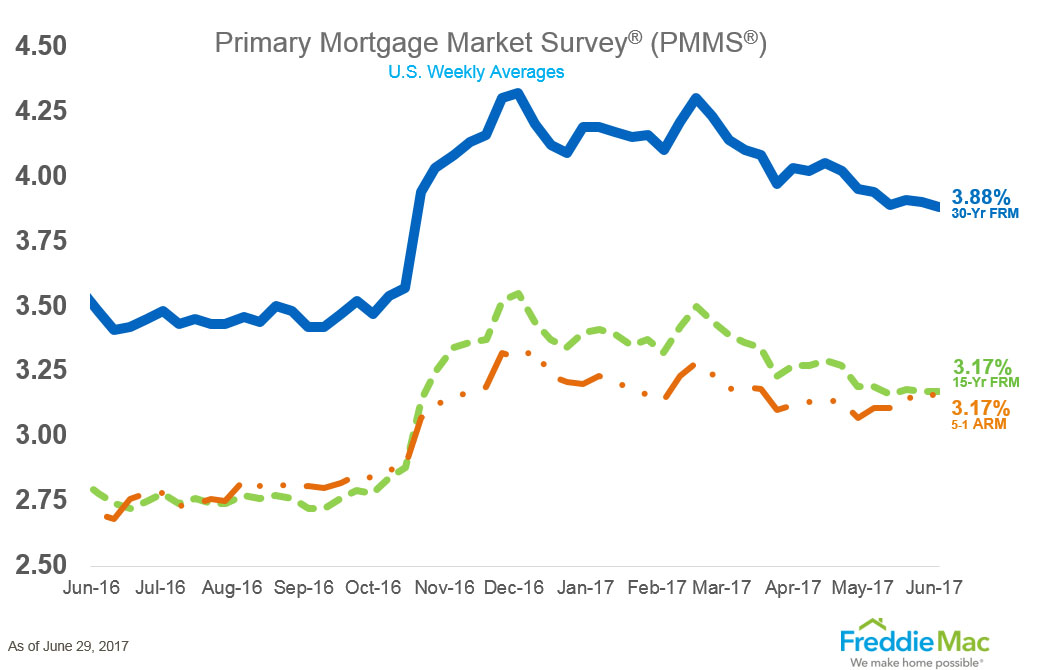
As can be seen from Freddie Mac's Mortgage Market Survey, last week, 30 Yr. Fixed Mortgage rates for conforming loans hit 3.88% sliding -0.02% basis points from last week.
Treasury Prices Rise and Yields Fall for U.S. 10 Yr. and 30 Yr. Treasuries.
At the Chicago Board of Trade (CBOT): the US 10 Year Treasury Note futures Contract for September settlement closed at a price of 125'17 / 32nds; the 10 Year Note was down 9 basis points (bps) on the day, yielding 2.3037%. The US 30 Year Treasury Bond futures Contract for Sept. settlement closed at a price of 153'22 / 32nds; the 30 Year Bond was down 18 basis points (bps) on the day, yielding 2.8348%. Mortgage Rates are now in a holding pattern just off their 2017 lows and are down -0.02% bps from the previous Freddie Mac Survey last week.
Thanks to ZeroHedge.com and FreddieMac.com for Charts and Graphics.
ERATE's Daily Rate Summary
June 29, 2017
Mortgage Rates Rise Treasury Yields Climb.
On Thursday, Treasury bond yields rose mightily and interest rates climbed for the second day in a row after Global Central Banks hint at coordinated 'Hawkishness'. Mortgage Rates grudgingly have followed the Credit Markets higher, so far. The September 10 Yr. U.S. Treasury Note stood at a yield of 2.2279% and the 30 Yr. U.S. Treasury Bond yielded 2.7810%. 30 Year Mortgages according to Freddie Mac were around 3.88% for conforming and 4.26% for Jumbo products.

As can be seen from the Fixed Mortgage Rates Charts above, we are still a long way from the lows of the Summer of last year. The trend is still down, but various Central Banks' communication is now coalescing around the gradual increase meme; despite continued deterioration of the US Macro Surprise Index. The window of opportunity for borrowers seeking mortgage refinancing & home purchases is still open for now, but for how long?
10 Year German Bund Yield rise to 0.315% (Chart courtesy of Zerohedge.com).
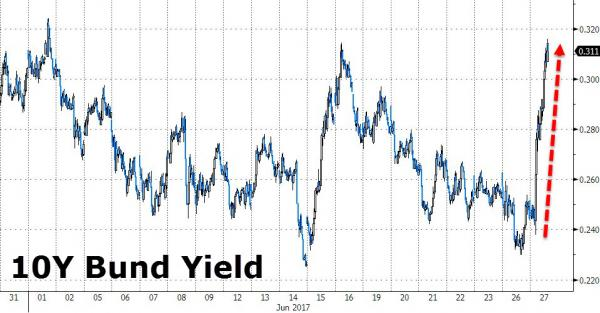
After 'Hawkish' comments from ECB President Mario Draghi on Wednesday, 10 Year Bund yields rose dramatically (from depressed levels) to above late May levels; it seems like most CB' have now taken the script (from Yellen) of gradually higher rates and another 'Taper Tantrum' has ensued…
10 Year Treasury Yields rise above 2.20% again (Chart courtesy of Zerohedge.com).
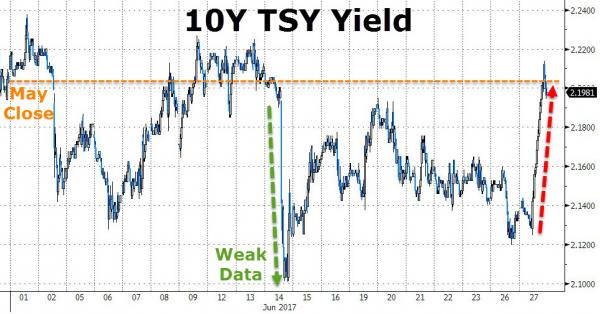
As displayed in the Chart, the U.S. 10 Year Treasury Note rose to a yield of 2.1981% after briefly eclipsing the May closing yield.
U.S. 2 Yr. vs. 10 Yr. Treasury Yield Spread reverses higher to 87 bps from below 80 bps
(Chart courtesy of Zerohedge.com).
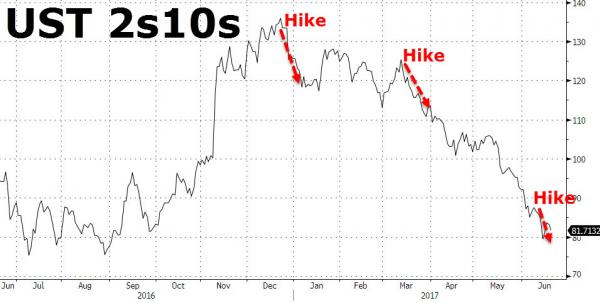
It appears that the trend since late December 2016 (the 2s10s spread) between short term U.S. Treasuries and longer-term Treasuries rates has now reversed higher after months of compression. This is an event that requires observation. As a move in the U.S. Treasury 2 Yr. vs 10 Yr. Yield Chart (see chart above); may presage higher Credit and Mortgage Rates to come this summer.
Implied Fed Funds Target Rate (Dot Plot) (Chart courtesy of Zerohedge.com).
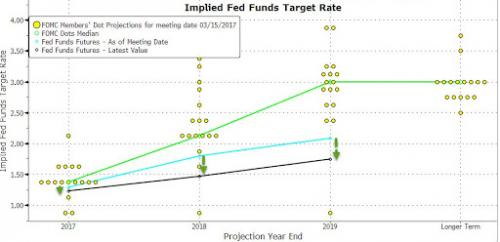
The so-called Dot Plot suggests that the Fed Funds Rate will be 1.50% by the end of 2017 which indicated only one additional rate hike this year and two in 2018.
Federal Reserve Market Implied # of Rate Hikes for 2017 (Chart courtesy of Zerohedge.com).
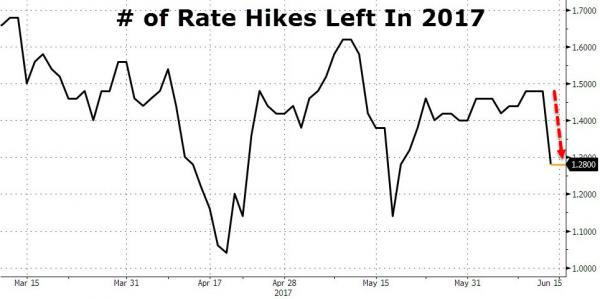
The Federal Reserve' current Market Implied # of Rate Hikes for 2017 has fallen recently to 1.28 from 1.50 three weeks ago; suggesting that macro-economic conditions are worsening somewhat recently and maybe not all the intended Fed Rate Hikes in 2017 (see dot plot) will happen.
Weekly Mortgage Rates Analysis
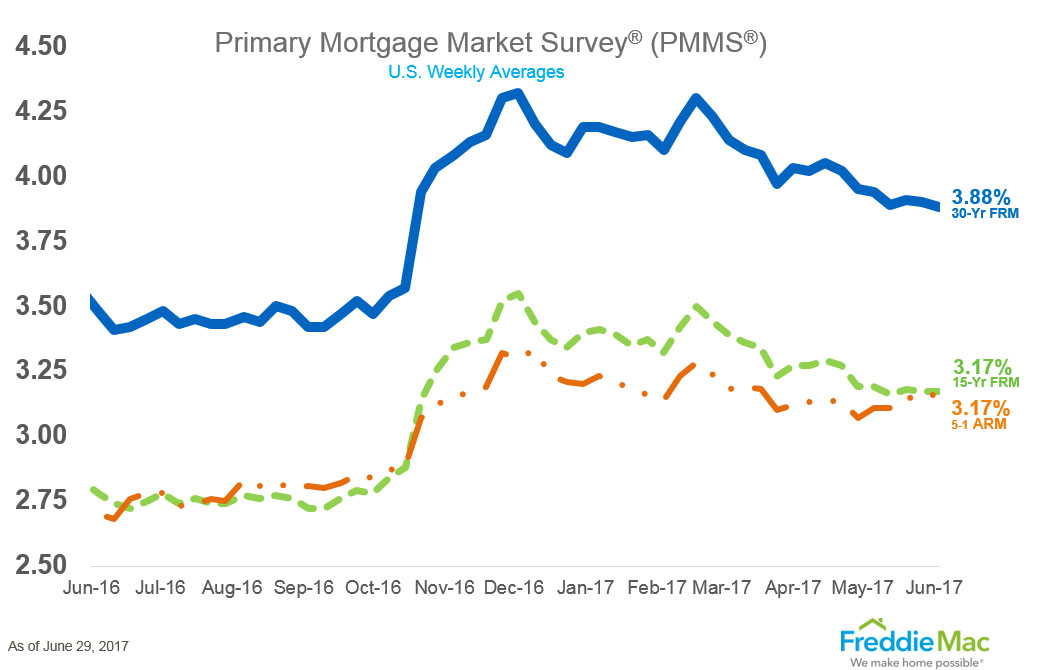
As can be seen from Freddie Mac' Mortgage Market Survey, last week, 30 Yr. Fixed Mortgage rates for conforming loans hit 3.88% sliding -0.02% basis points from last week.
Treasury Prices Rise and Yields Fall for U.S. 10 Yr. and 30 Yr. Treasuries.
At the Chicago Board of Trade (CBOT): the US 10 Year Treasury Note futures Contract for September settlement closed at a price of 126'06.5 / 32nds; the 10 Year Note was down 25 basis points (bps) on the day, yielding 2.2279%. The US 30 Year Treasury Bond futures Contract for Sept. settlement closed at a price of 155'00 / 32nds; the 30 Year Bond was down 22 basis points (bps) on the day, yielding 2.7810%. Mortgage Rates for now are holding at their 2017 lows and are down -0.02% bps from the previous Freddie Mac Survey last week.
Thanks to ZeroHedge.com and FreddieMac.com for Charts and Graphics.
ERATE's Daily Rate Summary
June 27, 2017
Mortgage Rates Steady Treasury Yields Unchanged.
On Monday, Treasury bond yields were lower and interest rates remained near the lowest levels so far for 2017. Mortgage Rates (despite the Fed June Rate Hike of 0.25%) have fallen nearly to the lowest levels of the year. The September 10 Yr. U.S. Treasury Note stood at a yield of 2.1370% and the 30 Yr. U.S. Treasury Bond yielded 2.6970%. 30 Year Mortgages according to Freddie Mac were around 3.89% for conforming and 4.23% for Jumbo products.

Since the March 15th meeting of the FOMC, Credit Spreads have significantly narrowed and the Treasury complex has continued to price in a deterioration of the US Macro Conditions in June (see Chart below). This has extended the lower-for-longer narrative and created a window of opportunity for borrowers seeking mortgages for refinances & new home purchases as Mortgage rates stay at low levels.
Durable Goods Orders vs S&P 500 Index (Courtesy of Zerohedge.com)
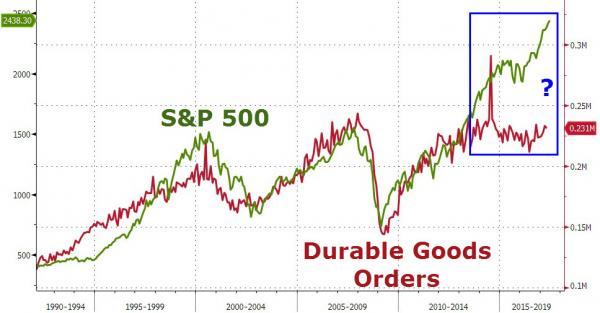
In May, Durable Goods Orders fell -1.1% and remain 5% below their 2007 peak. In comparison, the S&P 500 market index is 55% above the peak level achieved just before the GFC started. Clearly, the recovery on Wall Street hasn't been mirrored on Mainstreet. How this disconnect gets resolved will in large part determine whether or not the U.S. remains one society or two going forward. The questions is who is right the Fed or the Bond Markets?
Chicago Fed National Activity Index (Courtesy of Zerohedge.com)
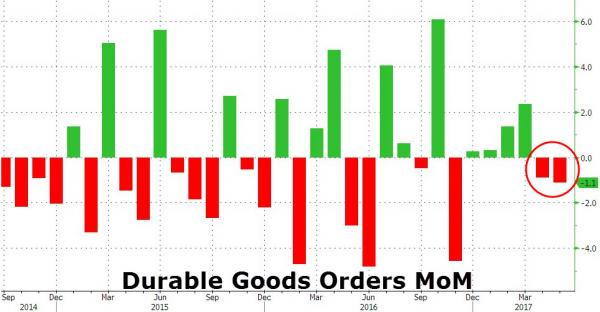
The Conference Board's May preliminary Durable Goods Orders tumbled -1.1% MoM (the worst since November). Across the entire report, numbers disappointed with Capital Goods Orders and Shipments both dropping considerably more than expected. In addition, the April data was revised downward to -0.8% from a previously reported positive reading (see Chart above). As displayed, this indicator is highly volatile on a month-to-month basis so far in 2017. As I posted yesterday, there is a dichotomy that is obvious between 'Hard' & 'Soft' economic data that is resolving itself in a slowing economy (see Chart below).
'Hard' Data vs 'Soft' Data (Courtesy of Zerohedge.com)
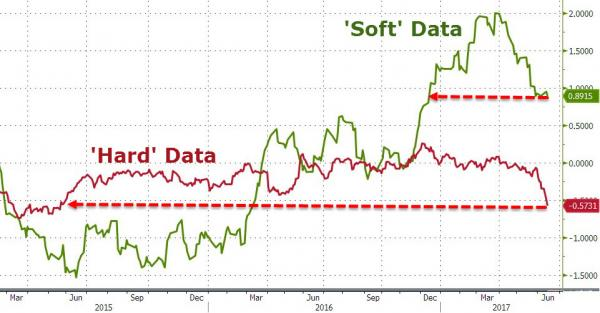
After months of divergence, it seems that U.S. economic 'Soft' Data (i.e. Sentiment Indicators, Consumer Confidence Indexes, and Stock Markets) are finally catching down to the 'Hard' Data (i.e. Durable Goods, Manufacturing Output, and GDP) indicating weak U.S. Economic Conditions; this is screaming 'Policy Error' as the Fed continues to raise short term rates.
Weekly Mortgage Rates Analysis
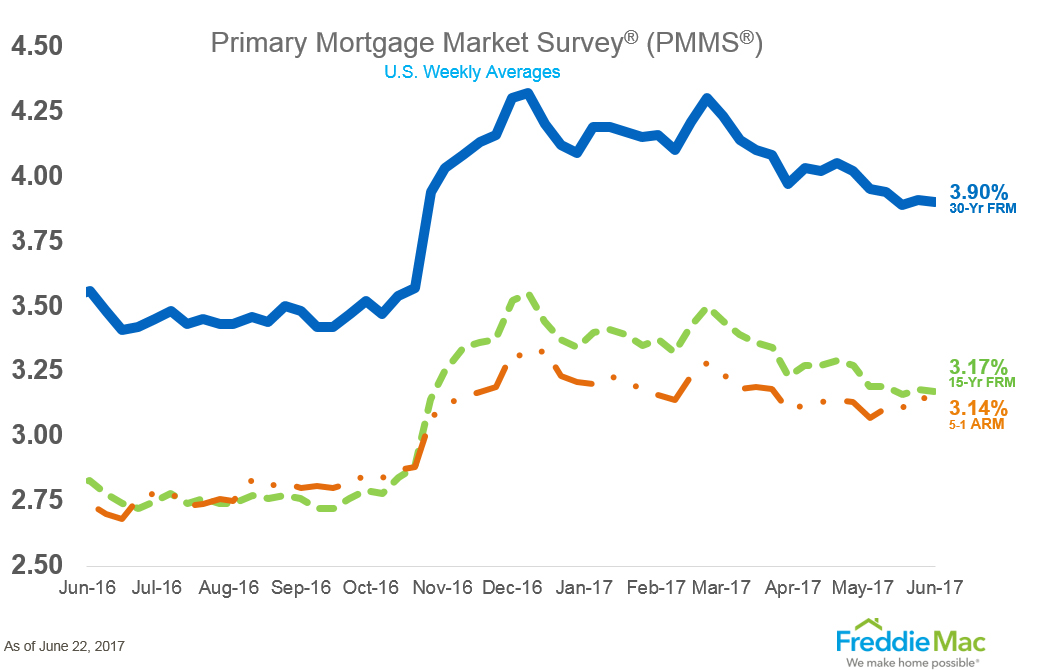
As can be seen from Freddie Mac's Mortgage Market Survey, last week, 30 Yr. Fixed Mortgage rates for conforming loans hit 3.90% inching down 0.01% basis point from last week.
Treasury Prices Rise and Yields Fall for U.S. 10 Yr. and 30 Yr. Treasuries.
At the Chicago Board of Trade (CBOT): the US 10 Year Treasury Note futures Contract for September settlement closed at a price of 126'25 / 32nds; the 10 Year Note was up 1.5 basis points (bps) on the day, yielding 2.1370%. The US 30 Year Treasury Bond futures Contract for Sept. settlement closed at a price of 156'29 / 32nds; the 30 Year Bond was up 9 basis point (bps) on the day, yielding 2.6970%. Mortgage Rates are near their lowest point so far in 2017, down -0.01% bps from the previous Freddie Mac Survey last week.
Thanks to ZeroHedge.com and FreddieMac.com for Charts and Graphics.
ERATE's Daily Rate Summary
June 26, 2017
Mortgage Rates Steady Treasury Yields Unchanged.
On Friday, Treasury bond yields were steady and interest rates remained near the lowest levels so far for 2017. Mortgage Rates (despite the Fed June Rate Hike of 0.25%) have fallen nearly to the lowest levels of the year. The September 10 Yr. U.S. Treasury Note stood at a yield of 2.1423% and the 30 Yr. U.S. Treasury Bond yielded 2.6853%. 30 Year Mortgages according to Freddie Mac were around 3.89% for conforming and 4.23% for Jumbo products.

Since the March 15th meeting of the FOMC, Credit Spreads have significantly narrowed and the Treasury complex has continued to price in a deterioration of the US Macro Conditions in June (see Chart below). This has extended the lower-for-longer narrative and created a window of opportunity for borrowers seeking mortgages for refinances & new home purchases as Mortgage rates stay at low levels.
U.S. Macro Surprise Index vs S&P 500 Index (Courtesy of Zerohedge.com)
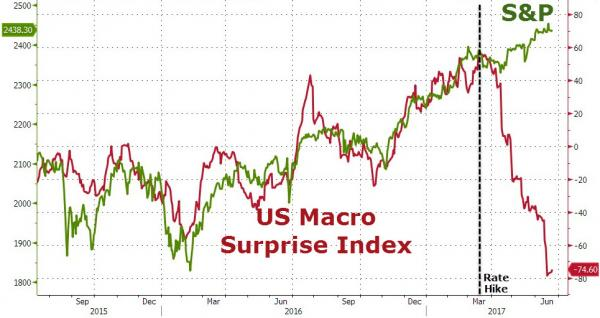
In June, the U.S. Macro Surprise Index continued to deteriorate as economic conditions worsened to a reading of -74.60 from -44.2 in the month of May. Since March, the Federal Reserve has seen economic activity slow but has followed a plan of gradual 0.25% point Fed Funds rate hikes. The questions is who is right the Fed or the Bond Markets?
Chicago Fed National Activity Index (Courtesy of Zerohedge.com)
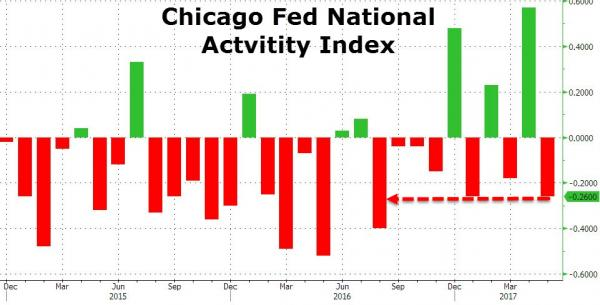
The Chicago Fed National Economic Activity Index plunged to -0.26 in May - the biggest drop since August 2016. (see Chart above). As displayed, this indicator is highly volatile on a month-to-month basis so far in 2017. The index draws on 85 economic indicators, and only 32 of the 85 monthly individual indicators made positive contributions.
G3 Central Bank Balance Sheet, Nasdaq, UST 2yr vs 30yr Spread, U.S. Macro and WTI Crude Prices (Courtesy of Zerohedge.com)
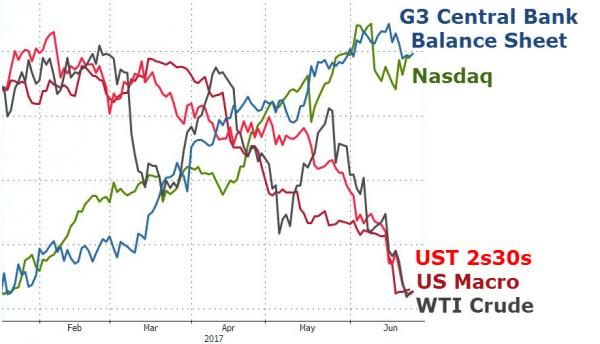
The S&P 500 and the Nasdaq are ignoring (since the GFC began and extraordinary CB intervention began, i.e. QE forever) the indicators of weak U.S. Economic Conditions; in favor of following the worldwide Central Bank liquidity injections for higher stock prices; setting up a false narrative of recovery, growth, & stability that will soon crumble.
Weekly Mortgage Rates Analysis
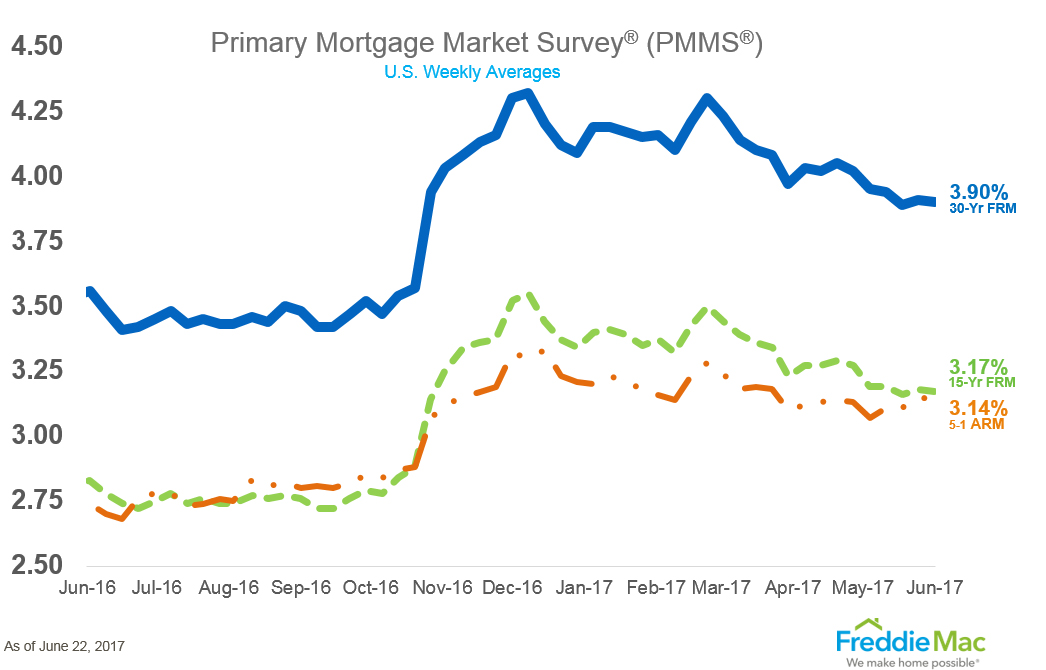
As can be seen from Freddie Mac’s Mortgage Market Survey, last week, 30 Yr. Fixed Mortgage rates for conforming loans hit 3.90% inching down 0.01% basis point from last week.
Treasury Prices Rise and Yields Fall for U.S. 10 Yr. and 30 Yr. Treasuries.
At the Chicago Board of Trade (CBOT): the US 10 Year Treasury Note futures Contract for September settlement closed at a price of 126’.23.5 / 32nds; the 10 Year Note was up 0.2 basis points (bps) on the day, yielding 2.1423%. The US 30 Year Treasury Bond futures Contract for Sept. settlement closed at a price of 156’20 / 32nds; the 30 Year Bond was up 5 basis point (bps) on the day, yielding 2.6853%. Mortgage Rates are near their lowest point so far in 2017, down -0.01% bps from the previous Freddie Mac Survey last week.
Thanks to ZeroHedge.com and FreddieMac.com for Charts and Graphics.
ERATE's Daily Rate Summary
June 23, 2017
Mortgage Rates Steady Treasury Yields Unchanged.
On Thursday, Treasury bond yields were steady and interest rates remained near the lowest levels so far for 2017. Mortgage Rates (despite the Fed June Rate Hike of 0.25%) have fallen nearly to the lowest levels of the year. The September 10 Yr. U.S. Treasury Note stood at a yield of 2.1477% and the 30 Yr. U.S. Treasury Bond yielded 2.7163%. 30 Year Mortgages according to Freddie Mac were around 3.90% for conforming and 4.23% for Jumbo products.

Since the March 15th meeting of the FOMC, Credit Spreads have significantly narrowed and the Treasury complex has continued to price in a deterioration of the US Macro Conditions in June. This has extended the lower-for-longer narrative and created a window of opportunity for borrowers seeking mortgages for refinances & new home purchases as Mortgage rates stay at low levels (see Chart below).
New Home Sales vs Mortgage Rates (Inverted) (Courtesy of Zerohedge.com)
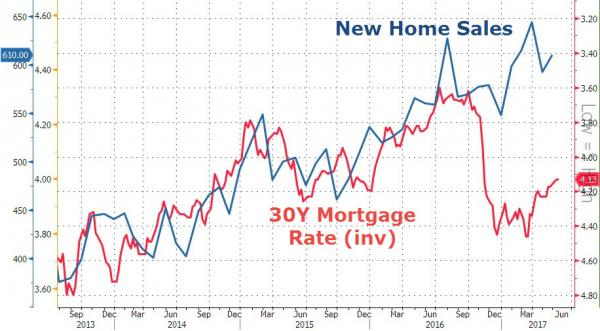
In May, Sales of New Homes rose strongly to an annualized rate of 610,000 units as Mortgage Rates continue to improve for the spring home buying season. The month-to-month increase in home sales included a big revision to April data which was originally report as 569,000 down -11.4% and was subsequently revised upward to annualized rate of 590,000 down just -7.6%. The big surprise was in the Median New Home Sale Price. According to the National Association of Realtors, the May 2017 Median New-Home price for all housing types was an all-time record at $345,800.
Historical New Home Sales & Price (Courtesy of Zerohedge.com)
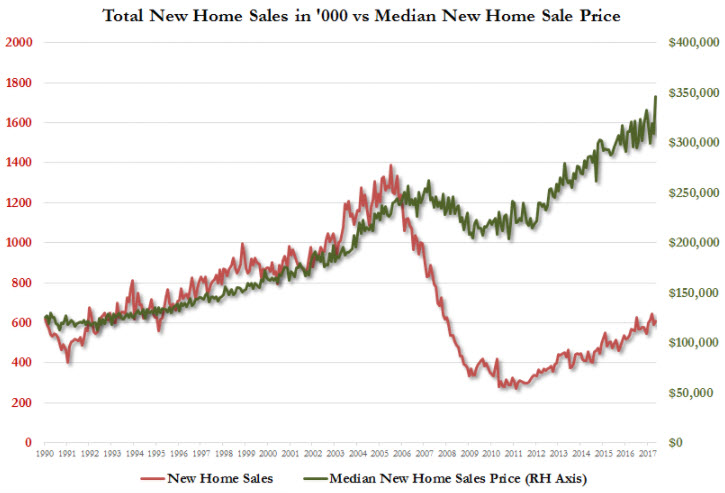
This is an 16% run-up in the Median New Home price in the first quarter of 2017 (see Chart below).
U.S. Median New Home Price Index (Courtesy of Zerohedge.com)
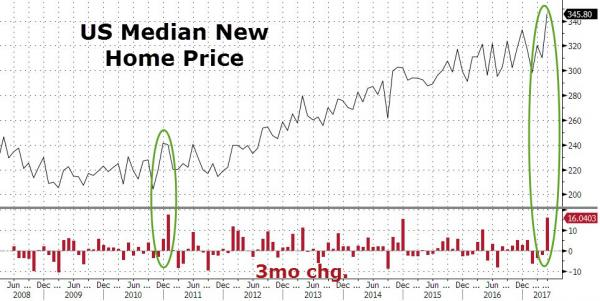
Weekly Mortgage Rates Analysis
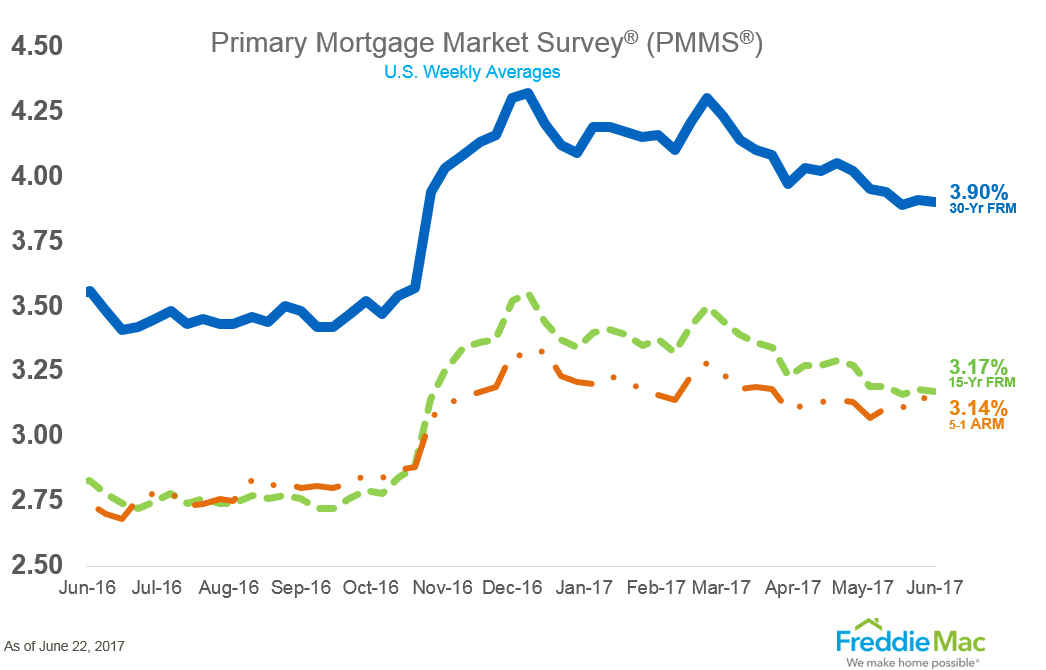
As can be seen from Freddie Mac's Mortgage Market Survey, last week, 30 Yr. Fixed Mortgage rates for conforming loans hit 3.90% inching down 0.01% basis point from last week.
Treasury Prices Rise and Yields Fall for U.S. 10 Yr. and 30 Yr. Treasuries.
At the Chicago Board of Trade (CBOT): the US 10 Year Treasury Note futures Contract for September settlement closed at a price of 126'21.5 / 32nds; the 10 Year Note was up 0.5 basis points (bps) on the day, yielding 2.1477%. The US 30 Year Treasury Bond futures Contract for Sept. settlement closed at a price of 156'15 / 32nds; the 30 Year Bond was down 1 basis point (bps) on the day, yielding 2.7163%. Mortgage Rates are near their lowest point so far in 2017, down -0.01% bps from the previous Freddie Mac Survey last week.
Thanks to ZeroHedge.com and FreddieMac.com for Charts and Graphics.
ERATE's Daily Rate Summary
June 21, 2017
Mortgage Rates Steady Treasury Yields Fall.
On Tuesday, Treasury bond yields fell modestly and interest rates remained near the lowest levels so far for 2017. Mortgage Rates (despite the Fed June Rate Hike of 0.25%) have fallen nearly to the lowest levels of the year. The September 10 Yr. U.S. Treasury Note stood at a yield of 2.1565% and the 30 Yr. U.S. Treasury Bond yielded 2.7385%. 30 Year Mortgages according to Freddie Mac were around 3.91% for conforming and 4.24% for Jumbo products.

Since the June 14th meeting of the FOMC, and the continued deterioration of the US Macro Surprise Index in June; the market has increasingly called into question the Fed narrative & commitment to gradual increases to the Federal Funds rate for 2017 and beyond. This has created a window of opportunity for borrowers seeking mortgage refinancing & home purchases as Mortgage rates continue to stay at low levels (see Chart below).
Existing Home Sales vs Mortgage Rates (Inverted) (Courtesy of Zerohedge.com)
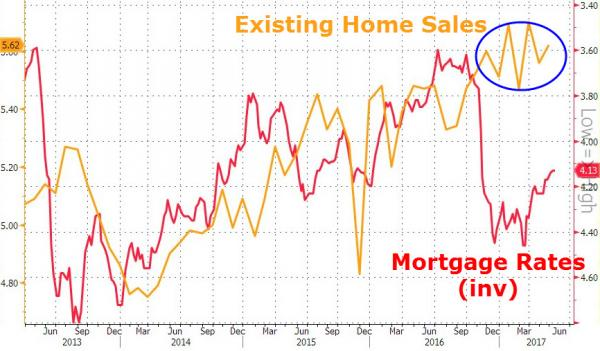
In May, Sales of Existing Homes rose modestly to an annualized rate of 5.62 million units as Mortgage Rates continue to improve for the spring home buying season. The month-to-month increase in home sales was up 1.4% vs an expected decline of -0.4%. First-time buyers accounted for 33 percent of sales in May, the April figure was 34%. According to the National Association of Realtors, the Inventory of available properties fell 8.4% from May 2016.The median existing-home price for all housing types in May was $252,800. This surpasses the peak last June of $247,600 and is up 5.8% from May 2016 level of $238,900.
Homebuilder Optimism vs New Home Sales (Courtesy of Zerohedge.com)
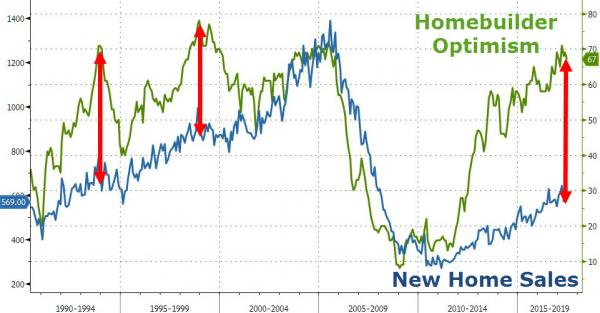
But there seems to be a growing gap between Homebuilder Optimism and New Home Sales which suggests at least an affordability issue or general buyer hesitation due to consumer confidence and overall economic conditions with past housing cycles (see Chart above & below).
Homebuilder Optimism vs Housing Surprise Index (Courtesy of Zerohedge.com)
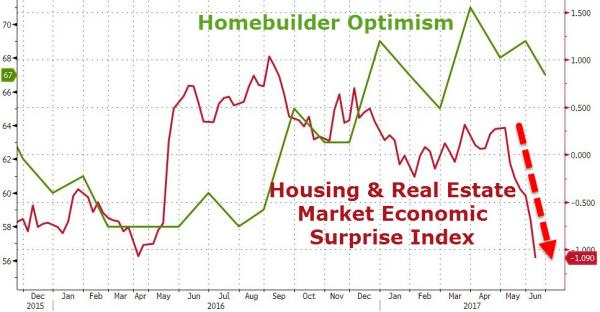
According to the Chief Economist, Lawrence Yun at the National Association of Realtors (NAR) in Washington D.C., "It is a very fast-moving market, meaning that homes placed on the market are being picked up very fast by buyers," He added, "We have job creation, yet home creation is not breaking out. There's sizable pent-up demand."
30 Year Treasury Yields fell to 2.7797% recently (Chart courtesy of Zerohedge.com).
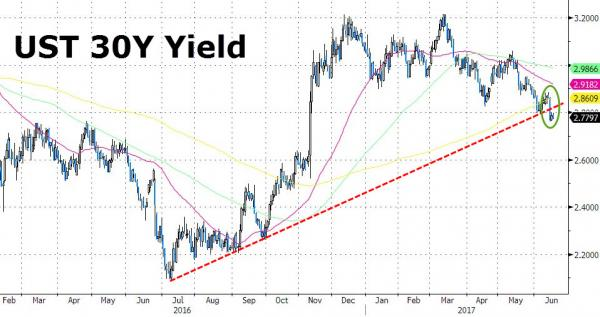
U.S. 30 Year Treasury Bond yields have been falling consistently since its 3rd Rate Hike at the March 15th meeting by the Federal Reserve and its decision to hike the Federal Funds Rate by 0.25%. The benchmark yield now stands just below 2.74%.
10 Year Treasury Yields fell to 2.10% briefly before rebounding (Chart courtesy of Zerohedge.com).
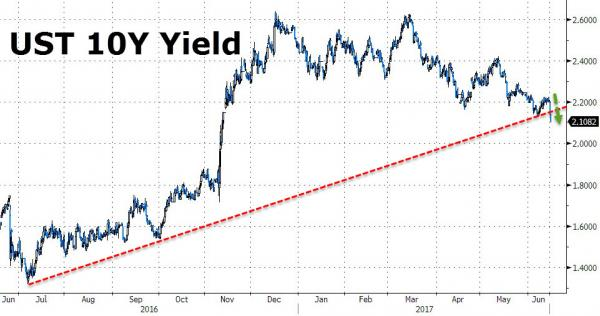
As displayed in the Chart, the U.S. 10 Year Treasury Note fell to 2.1082% briefly after the Federal Reserve increased the Fed Funds Rate to 1.25%.
U.S. 2 Yr. vs. 10 Yr. Treasury Yield Spreads is 0.81 bps (Chart courtesy of Zerohedge.com).
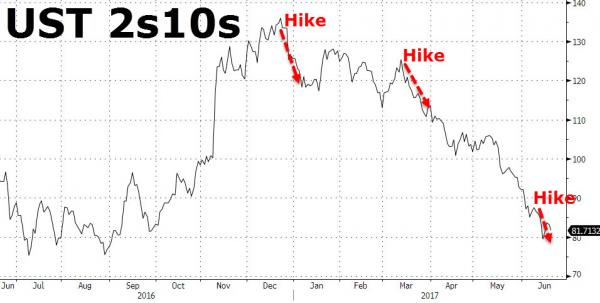
The long end of the Treasury yield curve is telling the Fed that the path for scheduled rate hikes is too aggressive for the anticipated growth rate for the economy or the fall in commodity prices is telegraphing weakness in inflation expectations ahead. As the U.S. Treasury 2 Yr. vs 10 Yr. Yield Chart indicates (see previous chart); every Fed Funds Rate 0.25% Rate Hike leads to a subsequent fall in market yield for the U.S. 10 Year Treasury Note.
Implied Fed Funds Target Rate (Dot Plot) (Chart courtesy of Zerohedge.com).
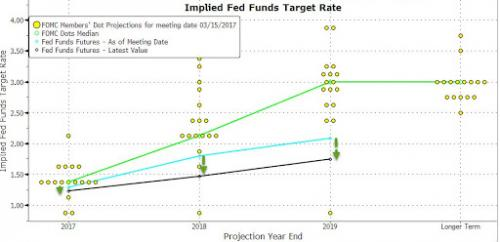
The so-called Dot Plot suggests that the Fed Funds Rate will be 1.50% by the end of 2017 which indicated only one additional rate hike this year and two in 2018.
Federal Reserve Market Implied # of Rate Hikes for 2017 (Chart courtesy of Zerohedge.com).
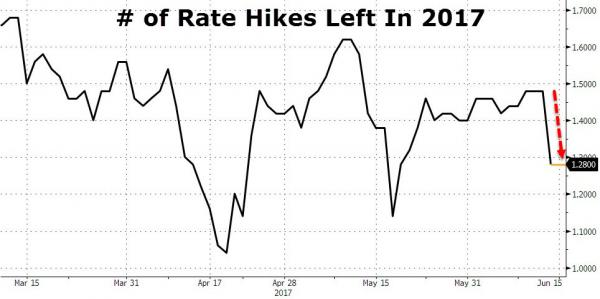
The Federal Reserve's current Market Implied # of Rate Hikes for 2017 has fallen recently to 1.28 from 1.50 three weeks ago; suggesting that macro-economic conditions are worsening somewhat recently and maybe not all the intended Fed Rate Hikes in 2017 (see dot plot) will be cashiered.
Weekly Mortgage Rates Analysis
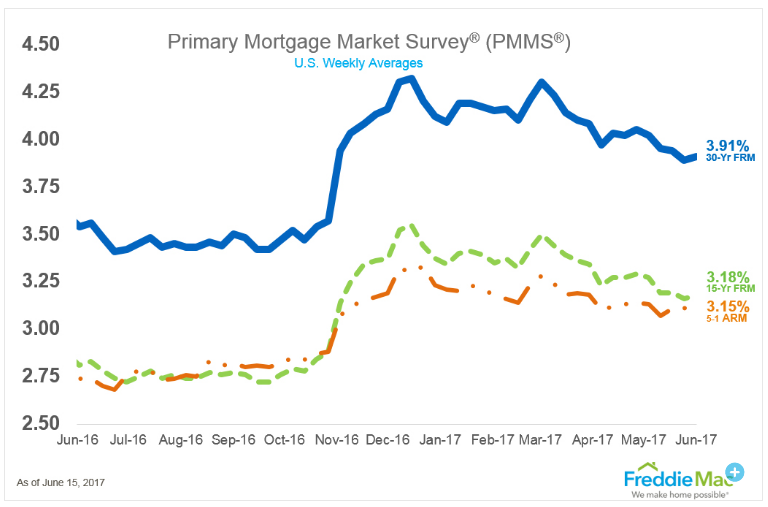
As can be seen from Freddie Mac's Mortgage Market Survey, last week, 30 Yr. Fixed Mortgage rates for conforming loans hit 3.91% inching up 0.02% basis point from last week.
Treasury Prices Rise and Yields Fall for U.S. 10 Yr. and 30 Yr. Treasuries.
At the Chicago Board of Trade (CBOT): the US 10 Year Treasury Note futures Contract for September settlement closed at a price of 126'24 / 32nds; the 10 Year Note was up 9.5 basis points (bps) on the day, yielding 2.1565%. The US 30 Year Treasury Bond futures Contract for Sept. settlement closed at a price of 156'13 / 32nds; the 30 Year Bond was up 31 basis points (bps) on the day, yielding 2.7385%. Mortgage Rates are near their lowest point so far in 2017, down -0.02% bps from the previous Freddie Mac Survey last week.
Thanks to ZeroHedge.com and FreddieMac.com for Charts and Graphics.
ERATE's Daily Rate Summary
June 19, 2017
Mortgage Rates Steady Treasury Yields Rise.
On Friday, Treasury yields and Mortgage Rates rose slightly after a big rally on Wednesday after the Federal Reserve Meeting on June 14th raised Fed Funds Rate by 0.25% as expected. The Fed statement was hawkish, but the bond market took the news favorably. Credit markets reacted bullishly and investors pushed Bond yields to their lowest of 2017. Mortgage Rates followed falling to their near-lowest levels of the year. The September 10 Yr. U.S. Treasury Note stood at a yield of 2.1514% and the 30 Yr. U.S. Treasury Bond yielded 2.7752%. 30 Year Mortgages according to Freddie Mac were around 3.91% for conforming and 4.21% for Jumbo products.

Since the June 14th meeting of the FOMC, and the continued deterioration of the US Macro Surprise Index in June; the market has increasingly called into question the Fed narrative & commitment to gradual increases to the Federal Funds rate for 2017 and beyond. This has created a window of opportunity for borrowers seeking mortgage refinancing & home purchases as Mortgage rate continue to stay at low levels.
30 Year Treasury Yields Have broken below 2.80% (Courtesy of Zerohedge.com)
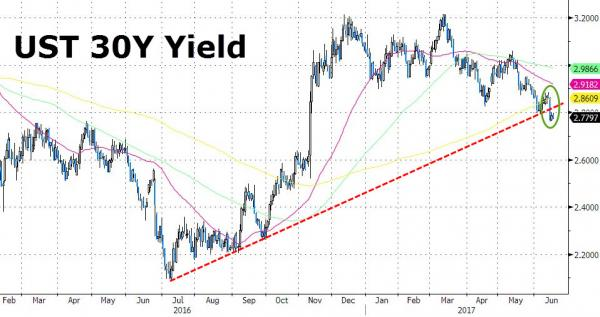
U.S. 30 Year Treasury Bond yields have been falling consistently since its 3rd Rate Hike at the March 15th meeting by the Federal Reserve and its decision to hike the Federal Funds Rate by 0.25%. The benchmark yield now stands just below 2.78%.
10 Year Treasury Yields fell to 2.10% briefly before rebounding (Chart courtesy of Zerohedge.com).
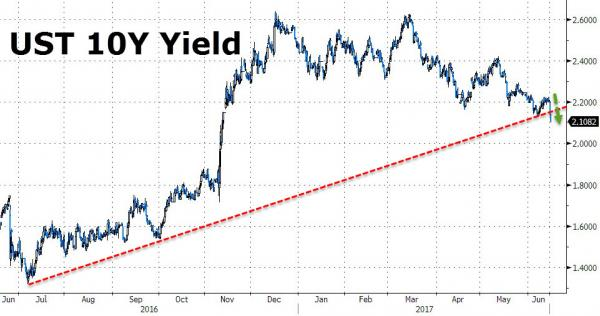
As displayed in the Chart, the U.S. 10 Year Treasury Note fell to 2.1082% briefly after the Federal Reserve increased the Fed Funds Rate to 1.25%.
U.S. 2 Yr. vs. 10 Yr. Treasury Yield Spreads is 0.80 bps (Chart courtesy of Zerohedge.com).
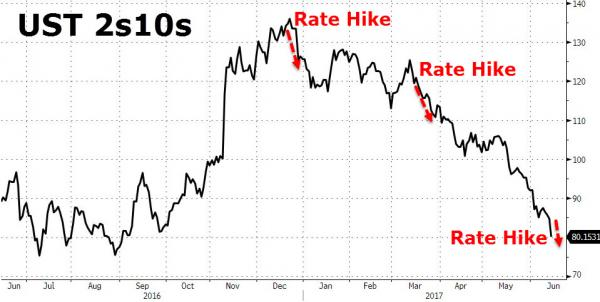
The long end of the Treasury yield curve is telling the Fed that the path for scheduled rate hikes is too aggressive for the anticipated growth rate for the economy or the fall in commodity prices is telegraphing weakness in inflation expectations ahead. As the U.S. Treasury 2 Yr. vs 10 Yr. Yield Chart indicates (see previous chart); every Fed Funds Rate 0.25% Rate Hike leads to a subsequent fall in market yield for the U.S. 10 Year Treasury Note.
This rally is counter-intuitive to the Fed's own Rate Hike path it has espoused in its post-meeting statement and minutes (see dot plot below). The Credit markets don't believe that the Fed will continue along its forecast path. Also, the targets for the Fed Balance Sheet Normalization came in at $10B per month and that was half the anticipated monthly reduction that Goldman Sachs economists had expected.
Implied Fed Funds Target Rate (Dot Plot) (Chart courtesy of Zerohedge.com).
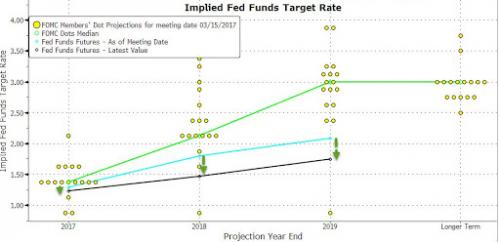
The so-called Dot Plot suggests that the Fed Funds Rate will be 1.50% by the end of 2017 which indicated only one additional rate hike this year and two in 2018.
Federal Reserve Market Implied # of Rate Hikes for 2017 (Chart courtesy of Zerohedge.com).
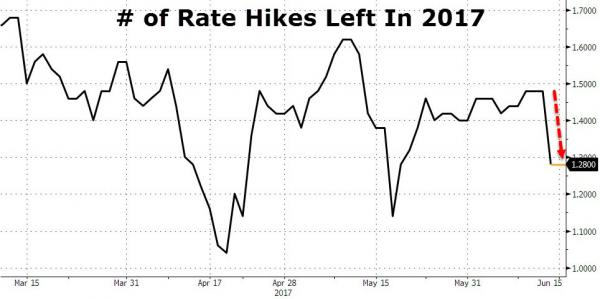
The Federal Reserve's current Market Implied # of Rate Hikes for 2017 has fallen recently to 1.28 from 1.50 three weeks ago; suggesting that macro-economic conditions are worsening somewhat recently and maybe not all the intended Fed Rate Hikes in 2017 (see dot plot) will be cashiered.
Weekly Mortgage Rates Analysis
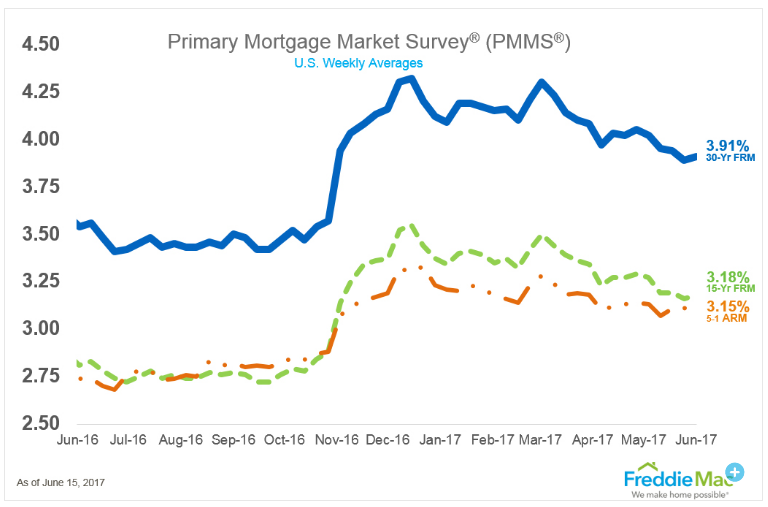
As can be seen from Freddie Mac's Mortgage Market Survey, last week, 30 Yr. Fixed Mortgage rates for conforming loans hit 3.91% inching up 0.02% basis point from last week.
Treasury Prices Rise and Yields Fall for U.S. 10 Yr. and 30 Yr. Treasuries.
At the Chicago Board of Trade (CBOT): the US 10 Year Treasury Note futures Contract for September settlement closed at a price of 126'24 / 32nds; the 10 Year Note was up 3.5 basis points (bps) on the day, yielding 2.1514%. The US 30 Year Treasury Bond futures Contract for Sept. settlement closed at a price of 155'20 / 32nds; the 30 Year Bond was up 5 basis points (bps) on the day, yielding 2.7752%. Mortgage Rates are at their lowest point so far in 2017, down -0.02% bps from the previous Freddie Mac Survey last week.
Thanks to ZeroHedge.com and FreddieMac.com for Charts and Graphics.
ERATE's Daily Rate Summary
June 16, 2017
Mortgage Rates Steady Treasury Yields Rise.
On Thursday, Treasury yields and Mortgage Rates rose slightly after a big rally on Wednesday after the Federal Reserve Meeting on June 14th raised Fed Funds Rate by 0.25% as expected. The Fed statement was hawkish, but the bond market took the news favorably. Credit markets reacted bullishly and investors pushed Bond yields to their lowest of 2017. Mortgage Rates followed falling to their near-lowest levels of the year. The September 10 Yr. U.S. Treasury Note stood at a yield of 2.1637% and the 30 Yr. U.S. Treasury Bond yielded 2.7872%. 30 Year Mortgages according to Freddie Mac were around 3.91% for conforming and 4.21% for Jumbo products.

Since the June 14th meeting of the FOMC, and the continued deterioration of the US Macro Surprise Index in June; the market has increasingly called into question the Fed narrative & commitment to gradual increases to the Federal Funds rate for 2017 and beyond. This has created a window of opportunity for borrowers seeking mortgage refinancing & home purchases as Mortgage rate continue to stay at low levels.
30 Year Treasury Yields Have broken below 2.80% (Courtesy of Zerohedge.com)
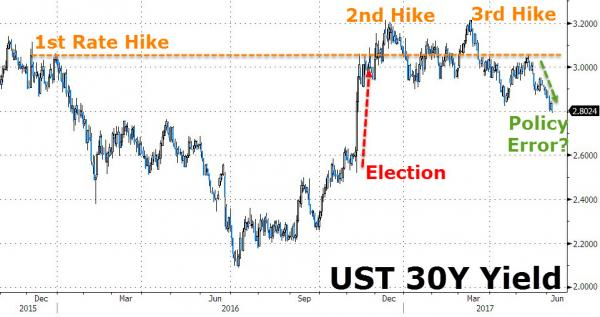
30 Year Treasury Bond yields have been falling consistently since its 3rd Rate Hike at the March 15th meeting by the Federal Reserve and its decision to hike the Federal Funds Rate by 0.25%. The benchmark yield now stands just below 2.86%.
10 Year Treasury Yields fell to 2.10% briefly before rebounding (Chart courtesy of Zerohedge.com).
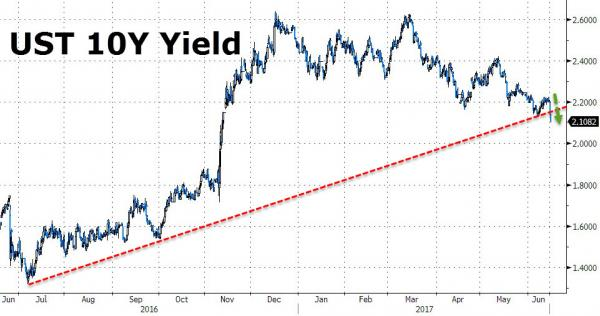
As displayed in the Chart, the U.S. 10 Year Treasury Note fell to 2.1082% briefly after the Federal Reserve increased the Fed Funds Rate to 1.25%. This rally is counter-intuitive to the Fed's own Rate Hike path it has espoused in its post-meeting statement and minutes (see dot plot below). The Credit markets don't believe that the Fed will continue along its forecast path. Also, the targets for the Fed Balance Sheet Normalization came in at $10B per month and that was half the anticipated monthly reduction that Goldman Sachs economists had expected.
The long end of the Treasury yield curve is telling the Fed that the path for scheduled rate hikes is too aggressive for the anticipated growth rate for the economy or the fall in commodity prices is telegraphing weakness in inflation expectations ahead.
Implied Fed Funds Target Rate (Dot Plot) (Chart courtesy of Zerohedge.com).
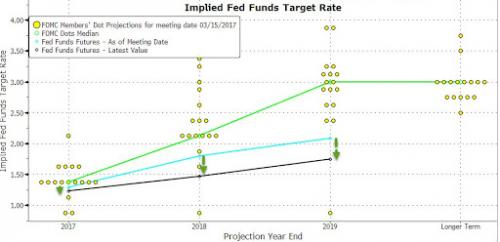
The so-called Dot Plot suggests that the Fed Funds Rate will be 1.50% by the end of 2017 which indicated only one additional rate hike this year and two in 2018.
Federal Reserve Market Implied # of Rate Hikes for 2017 (Chart courtesy of Zerohedge.com).
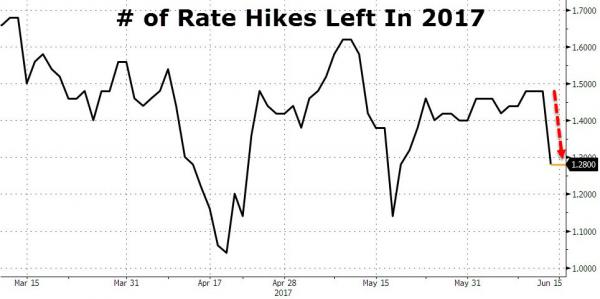
The Federal Reserve's current Market Implied # of Rate Hikes for 2017 has fallen recently to 1.28 from 1.50 three weeks ago; suggesting that macro-economic conditions are worsening somewhat recently and maybe not all the intended Fed Rate Hikes in 2017 (see dot plot) will be cashiered.
Weekly Mortgage Rates Analysis
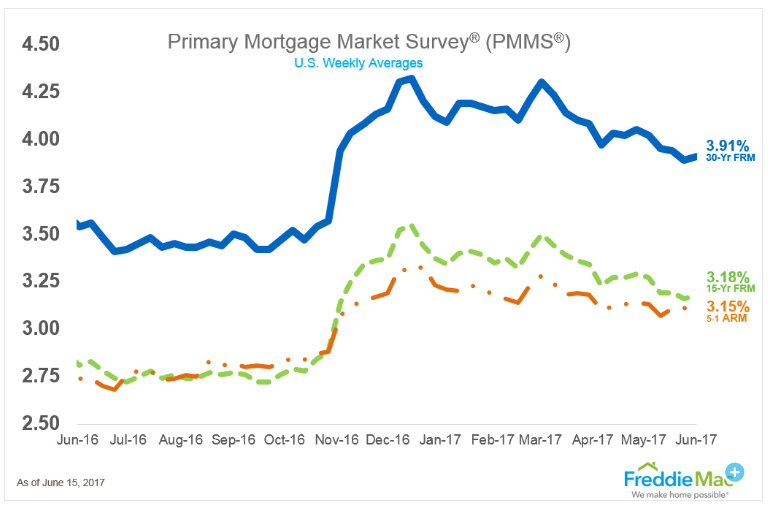
As can be seen from Freddie Mac's Mortgage Market Survey, last week, 30 Yr. Fixed Mortgage rates for conforming loans hit 3.91% inching up 0.02% basis point from last week.
Treasury Prices Rise and Yields Fall for U.S. 10 Yr. and 30 Yr. Treasuries.
At the Chicago Board of Trade (CBOT): the US 10 Year Treasury Note futures Contract for September settlement closed at a price of 126'20.5 / 32nds; the 10 Year Note was down 9 basis points (bps) on the day, yielding 2.1637%. The US 30 Year Treasury Bond futures Contract for Sept. settlement closed at a price of 155'15 / 32nds; the 30 Year Bond was down 5 basis points (bps) on the day, yielding 2.7872%. Mortgage Rates are at their lowest point so far in 2017, down -0.02% bps from the previous Freddie Mac Survey last week.
Thanks to ZeroHedge.com and FreddieMac.com for Charts and Graphics.
ERATE's Daily Rate Summary
June 12, 2017
Mortgage Rates Steady Treasury Yields Rise.
On Friday, Treasury yields and Mortgage Rates were lower. Continuing the market fallout from the disappointing BLS May Unemployment Report from the previous week on both Jobs and Wages. Credit markets reacted bullishly and investors pushed Bond yields to their lowest of 2017. Mortgage Rates followed falling to their lowest levels of the year and call into question the Fed espoused plan to Raise Fed Funds by a 0.25% at its June 14th meeting. The September 10 Yr. U.S. Treasury Note stood at a yield of 2.2005% and the 30 Yr. U.S. Treasury Bond yielded 2.8556%. 30 Year Mortgages according to Freddie Mac were around 3.89% for conforming and 4.20% for Jumbo products.

Since the release of the FOMC Minutes, and the continued deterioration of the US Macro Surprise Index in June; the market has increasingly called into question the Fed narrative & commitment to gradual increases to the Federal Funds rate at the June 14th meeting. This has created a window of opportunity for borrowers seeking mortgage refinancing & home purchases as Mortgage rate continue to stay at low levels.
30 Year Treasury Yields Have broken below 2.90% (Courtesy of Zerohedge.com)
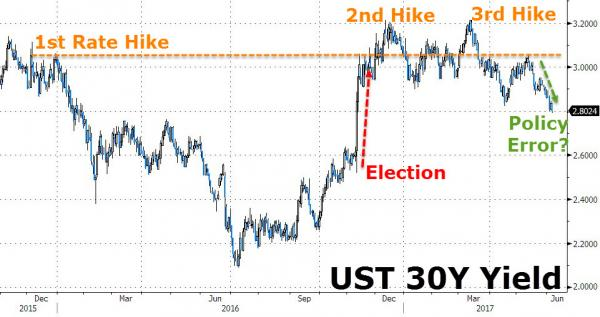
30 Year Treasury Bond yields have been falling consistently since the March 15th meeting by the Federal Reserve and its decision to hike the Federal Funds Rate by 0.25%. The benchmark yield now stands just below 2.86%.
June Rate Hike Odds Rise to 100% then Fall (Chart courtesy of Zerohedge.com).
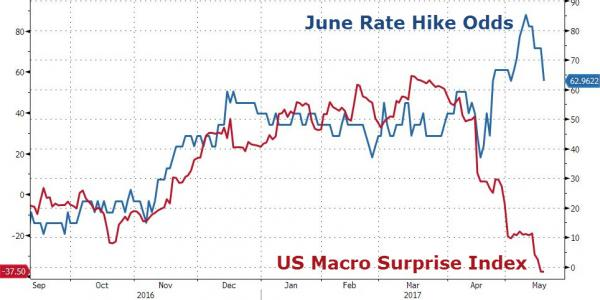

As displayed in the Chart, the odds of a June rate hike by the Federal Reserve have been volatile during the past few weeks oscillating between 100% and 37%. The market is currently discounting an 95% probability that the Fed will raise rates in June and keep to its espoused path of tightening in the Federal Funds rate, even though its own updated Implied Fed Funds Target Rate (Dot Plot) still shows two or three increase in 2017.
If the long end of the Treasury yield curve refuses to rise even with 2 or 3 scheduled rate hikes its telling the Fed that rates are too high for the anticipated growth rate for the economy or the fall in commodity prices is telegraphing weakness in inflation expectations ahead. Either way, higher long term interest rates may not last out the year.
Implied Fed Funds Target Rate (Dot Plot) (Chart courtesy of Zerohedge.com).
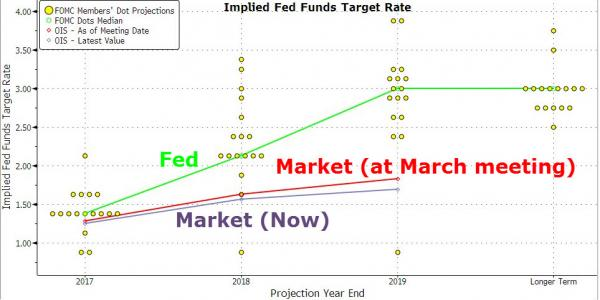
The so-called Dot Plot suggests that the Fed Funds Rate will be 2.00% by the end of 2017 which indicated two additional rate hikes this year.
Federal Reserve Market Implied # of Rate Hikes for 2017 (Chart courtesy of Zerohedge.com).
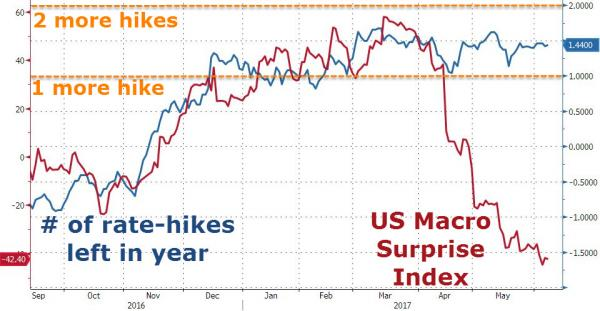
The Federal Reserve's current Market Implied # of Rate Hikes for 2017 has fallen recently to 1.44 from 1.60 three weeks ago; suggesting that macro-economic conditions are worsening somewhat recently and maybe not all the intended Fed Rate Hikes in 2017 (see dot plot) will be cashiered.
Weekly Mortgage Rates Analysis
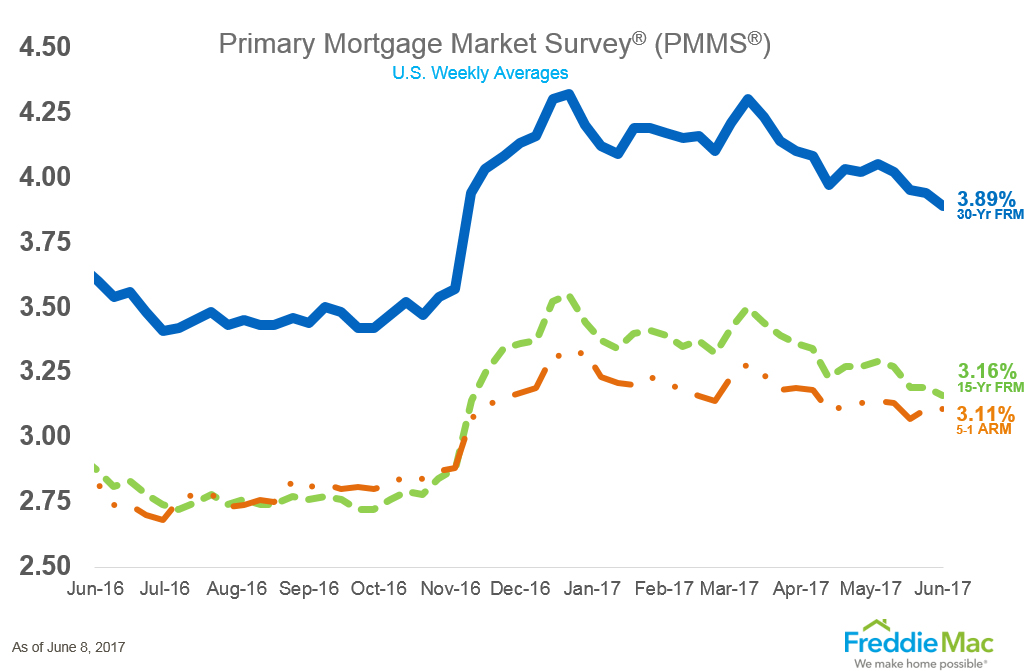
As can be seen from Freddie Mac's Mortgage Market Survey, last week, 30 Yr. Fixed Mortgage rates for conforming loans hit 3.89% down -0.05% basis point from last week.
Treasury Prices Rise and Yields Fall for U.S. 10 Yr. and 30 Yr. Treasuries.
At the Chicago Board of Trade (CBOT): the US 10 Year Treasury Note futures Contract for September settlement closed at a price of 126'13.5 / 32nds; the 10 Year Note was down 1 basis points (bps) on the day, yielding 2.2005%. The US 30 Year Treasury Bond futures Contract for Sept. settlement closed at a price of 154'07 / 32nds; the 30 Year Bond was down 1 basis points (bps) on the day, yielding 2.8556%. Mortgage Rates are at their lowest point so far in 2017, down -0.05% bps from the previous Freddie Mac Survey last week.
Thanks to ZeroHedge.com and FreddieMac.com for Charts and Graphics.
ERATE's Daily Rate Summary
June 5, 2017
Mortgage Rates Steady Treasury Yields Rise.
On Friday, Treasury yields and Mortgage Rates were lower after the BLS May Unemployment Report disappointed on both Jobs and Wages. Credit markets reacted bullishly and investors pushed Bond yields to their lowest of 2017. Mortgage Rates followed falling to their lowest levels of the year and call into question the Fed espoused plan to Raise Fed Funds by a 0.25% at its June 14th meeting. The September 10 Yr. U.S. Treasury Note stood at a yield of 2.1591% and the 30 Yr. U.S. Treasury Bond yielded 2.8100%. 30 Year Mortgages according to Freddie Mac were around 3.94% for conforming and 4.26% for Jumbo products.

Since the release of the FOMC Minutes, and the continued deterioration of the US Macro Surprise Index in May; the market has increasingly called into question the Fed narrative & commitment to gradual increases to the Federal Funds rate at the June meeting. This has created a window of opportunity for borrowers seeking mortgage refinancing & home purchases as Mortgage rate continue to stay at low levels. As I wrote in previous missives, the U.S. Bond market continues to be well bid as economic growth softens this Spring.
30 Year Treasury Yields Have broken below 2.90% (Courtesy of Zerohedge.com)
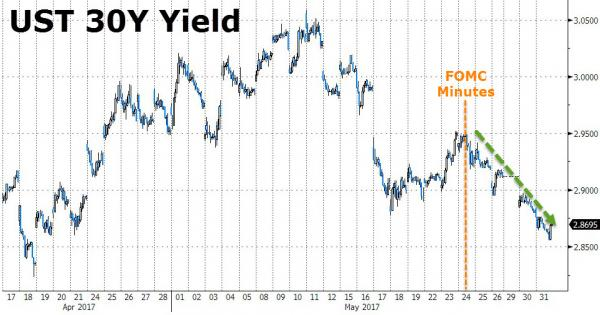
30 Year Treasury Bond yields have been falling consistently since the March 15th meeting by the Federal Reserve and its decision to hike the Federal Funds Rate by 0.25%. The benchmark yield now stands just below 2.82%.
June Rate Hike Odds Rise to 100% then Fall (Chart courtesy of Zerohedge.com).
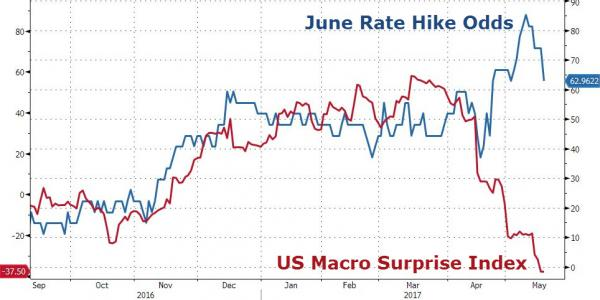

As displayed in the Chart, the odds of a June rate hike by the Federal Reserve have been volatile during the past few weeks oscillating between 100% and 37%. The market is currently discounting an 95% probability that the Fed will raise rates in June and keep to its espoused path of tightening in the Federal Funds rate, even though its own updated Implied Fed Funds Target Rate (Dot Plot) still shows two or three increase in 2017.
If the long end of the Treasury yield curve refuses to rise even with 2 or 3 scheduled rate hikes its telling the Fed that rates are too high for the anticipated growth rate for the economy or the fall in commodity prices is telegraphing weakness in inflation expectations ahead. Either way, higher long term interest rates may not last out the year.
Implied Fed Funds Target Rate (Dot Plot) (Chart courtesy of Zerohedge.com).
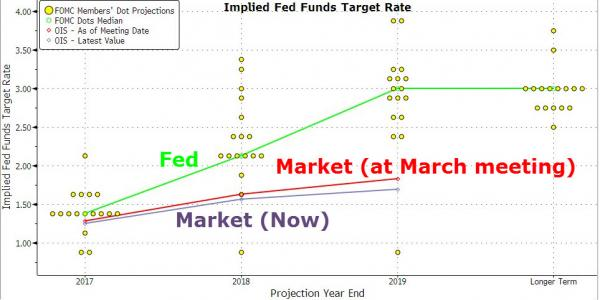
The so-called Dot Plot suggests that the Fed Funds Rate will be 2.00% by the end of 2017 which indicated two additional rate hikes this year.
Federal Reserve Market Implied # of Rate Hikes for 2017 (Chart courtesy of Zerohedge.com).
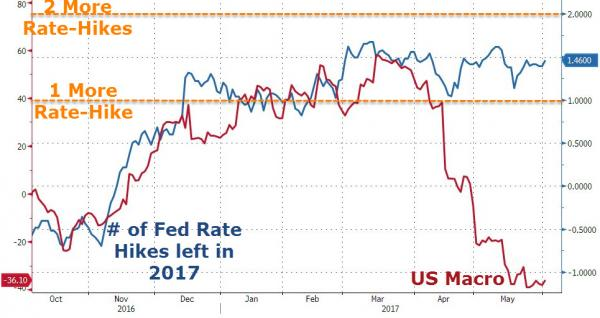
The Federal Reserve's current Market Implied # of Rate Hikes for 2017 has fallen recently to 1.46 from 1.60 three weeks ago; suggesting that macro-economic conditions are worsening somewhat recently and maybe not all the intended Fed Rate Hikes in 2017 (see dot plot) will be cashiered.
Weekly Mortgage Rates Analysis
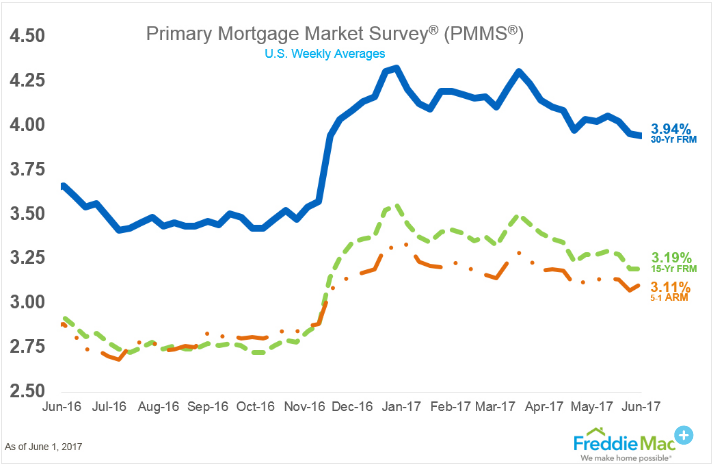
As can be seen from Freddie Mac's Mortgage Market Survey, last week, 30 Yr. Fixed Mortgage rates for conforming loans hit 3.94% down -0.01% basis point from last week.
Treasury Prices Rise and Yields Fall for U.S. 10 Yr. and 30 Yr. Treasuries.
At the Chicago Board of Trade (CBOT): the US 10 Year Treasury Note futures Contract for September settlement closed at a price of 126'20.5 / 32nds; the 10 Year Note was up 14.5 basis points (bps) on the day, yielding 2.1591%. The US 30 Year Treasury Bond futures Contract for Sept. settlement closed at a price of 154'27 / 32nds; the 30 Year Bond was up 42 basis points (bps) on the day, yielding 2.8100%. Mortgage Rates are at their lowest point so far in 2017, down -0.01% bps from the previous Freddie Mac Survey last week.
Thanks to ZeroHedge.com and FreddieMac.com for Charts and Graphics.
ERATE's Daily Rate Summary
May 30, 2017
Mortgage Rates Steady Treasury Yields Rise.
On Friday, Treasury yields and Mortgage Rates were unchanged after the six weeks of lower yields to usher in the spring home-buying season. Credit markets have paused and the six week rally in bonds & lower mortgage interest rates has consolidated. The 10 Yr. U.S. Treasury Note stood at a yield of 2.2465% and the 30 Yr. U.S. Treasury Bond yielded 2.9120%. 30 Year Mortgages according to Freddie Mac were around 3.95% for conforming and 4.27% for Jumbo products.

For now, the improvement in mortgage rates post Fed has come to a halt, with the Fed increasingly sticking to its commitment to gradual increases to the Federal Funds rate at the June meeting. The door is still open for mortgage refinancing & home purchases as Mortgage rate continue to stay at low levels. As I wrote in previous missives, the U.S. Bond market is serenely calm as to the future Debt Ceiling negotiations, Interest Rate increases, and signs of Inflation (they had that covered by punting until September fiscal year end).
30 Year Treasury Yields Have Fallen below 3.00% (Courtesy of Zerohedge.com)
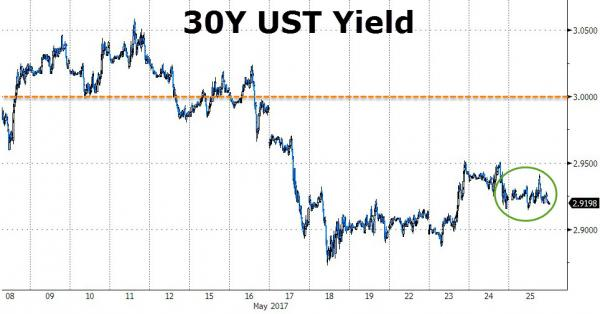
30 Year Treasury Bond yields have been falling consistently since the March 15th meeting by the Federal Reserve and its decision to hike the Federal Funds Rate by 0.25%. The benchmark yield now stands just below 2.92%.
June Rate Hike Odds Rise above 100% then Fall (Chart courtesy of Zerohedge.com).
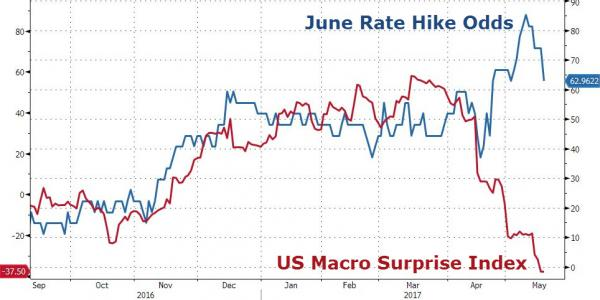
As displayed in the Chart, the odds of a June rate hike by the Federal Reserve have been volatile during the past few weeks oscillating between 100% and 37%. The market is currently discounting an 95% probability that the Fed will raise rates in June and keep to its espoused path of tightening in the Federal Funds rate, even though its own updated Implied Fed Funds Target Rate (Dot Plot) still shows two or three increase in 2017.
If the long end of the Treasury yield curve refuses to rise even with 2 or 3 scheduled rate hikes its telling the Fed that rates are too high for the anticipated growth rate for the economy or the fall in commodity prices is telegraphing weakness in inflation expectations ahead. Either way, higher long term interest rates may not last out the year.
Implied Fed Funds Target Rate (Dot Plot) (Chart courtesy of Zerohedge.com).

The so-called Dot Plot suggests that the Fed Funds Rate will be 2.00% by the end of 2017 which indicated two additional rate hikes this year.
Federal Reserve Market Implied # of Rate Hikes for 2017 (Chart courtesy of Zerohedge.com).
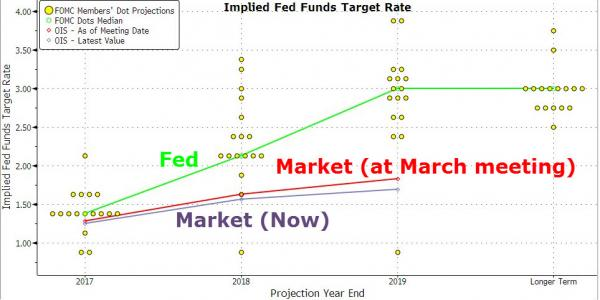
The Federal Reserve's current Market Implied # of Rate Hikes for 2017 has fallen recently to 1.44 from 1.60 two weeks ago; suggesting that macro-economic conditions are worsening somewhat recently and maybe not all the intended Fed Rate Hikes in 2017 (see dot plot) will be cashiered.
Weekly Mortgage Rates Analysis
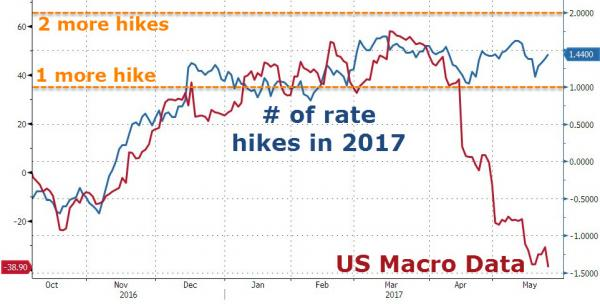
As can be seen from Freddie Mac's Mortgage Market Survey, last week, 30 Yr. Fixed Mortgage rates for conforming loans hit 3.95% just in time for the Spring home-buying season.
Treasury Prices Rise and Yields Fall for U.S. 10 Yr. and 30 Yr. Treasuries.
On the Chicago Board of Trade (CBOT): the US 10 Year Treasury Note futures Contract for June settlement closed at a price of 126'06 / 32nds; the 10 Year Note was up 0.5 basis points (bps) on the day, yielding 2.2465%. The US 30 Year Treasury Bond futures Contract for June settlement closed at a price of 153'29 / 32nds; the 30 Year Bond was up 2 basis points (bps) on the day, yielding 2.9120%. Mortgage Rates are at their lowest point so far in 2017, down -0.07% from the previous Freddie Mac Survey last week.
Thanks to ZeroHedge.com and FreddieMac.com for Charts and Graphics.
ERATE's Daily Rate Summary
May 22, 2017
Mortgage Rates Steady Treasury Yields Rise.
On Friday, Treasury yields and Mortgage Rates were unchanged after the six weeks of lower yields to usher in the spring home-buying season. Credit markets have paused and the six week rally in bonds & lower mortgage interest rates has consolidated. The 10 Yr. U.S. Treasury Note stood at a yield of 2.2346% and the 30 Yr. U.S. Treasury Bond yielded 2.8966%. 30 Year Mortgages according to Freddie Mac were around 4.02% for conforming and 4.59% for Jumbo products.

For now, the improvement in mortgage rates post Fed has come to a halt, with the Fed increasingly sticking to its commitment to gradual increases to the Federal Funds rate at the June meeting. The door is still open for mortgage refinancing & home purchases as Mortgage rate continue to stay at low levels. As I wrote in previous missives, the U.S. Bond market is serenely calm as to the future Debt Ceiling negotiations, Interest Rate increases, and signs of Inflation (they had that covered by punting until September fiscal year end).
30 Year Treasury Yields Have Fallen below 3.00% (Courtesy of Zerohedge.com)
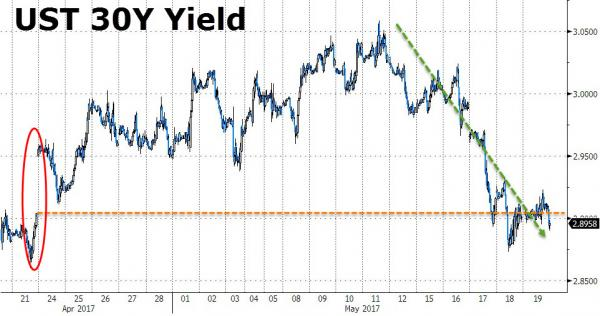
30 Year Treasury Bond yields have been falling consistently since the March 15th meeting by the Federal Reserve and its decision to hike the Federal Funds Rate by 0.25%. The benchmark yield now stands just below 2.90%.
June Rate Hike Odds Rise above 85% then Fall (Chart courtesy of Zerohedge.com).
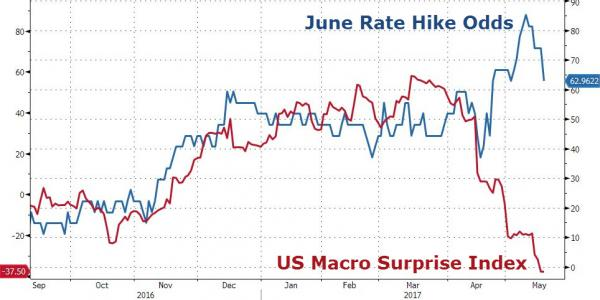
As displayed in the Chart, the odds of a June rate hike by the Federal Reserve have been volatile during the past few weeks oscillating between 85% and 37%. The market is currently discounting an 62% probability that the Fed will raise rates in June and keep to its espoused path of tightening in the Federal Funds rate, even though its own updated Implied Fed Funds Target Rate (Dot Plot) still shows two or three increase in 2017.
If the long end of the Treasury yield curve refuses to rise even with 2 or 3 scheduled rate hikes its telling the Fed that rates are too high for the anticipated growth rate for the economy or the fall in commodity prices is telegraphing weakness in inflation expectations ahead. Either way, higher long term interest rates may not last out the year.
Implied Fed Funds Target Rate (Dot Plot) (Chart courtesy of Zerohedge.com).
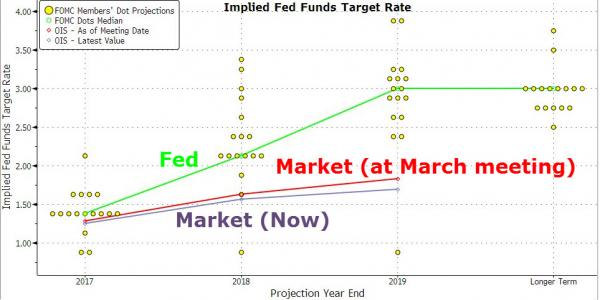
The so-called Dot Plot suggests that the Fed Funds Rate will be 1.75% by the end of 2017 which indicated two additional rate hikes this year.
Federal Reserve Market Implied # of Rate Hikes for 2017 (Chart courtesy of Zerohedge.com).
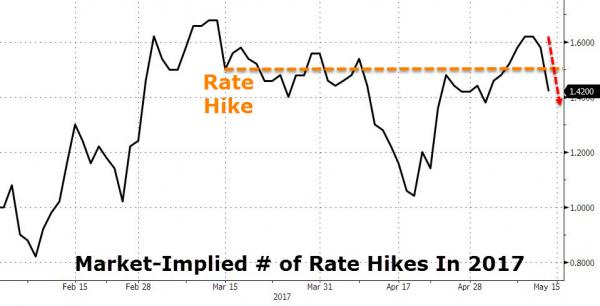
The Federal Reserve’s current Market Implied # of Rate Hikes for 2017 has fallen recently to 1.42 from 1.60 two weeks ago; suggesting that macro-economic conditions are worsening somewhat recently and maybe not all the intended Fed Rate Hikes in 2017 (see dot plot) will be cashiered.
Weekly Mortgage Rates Analysis
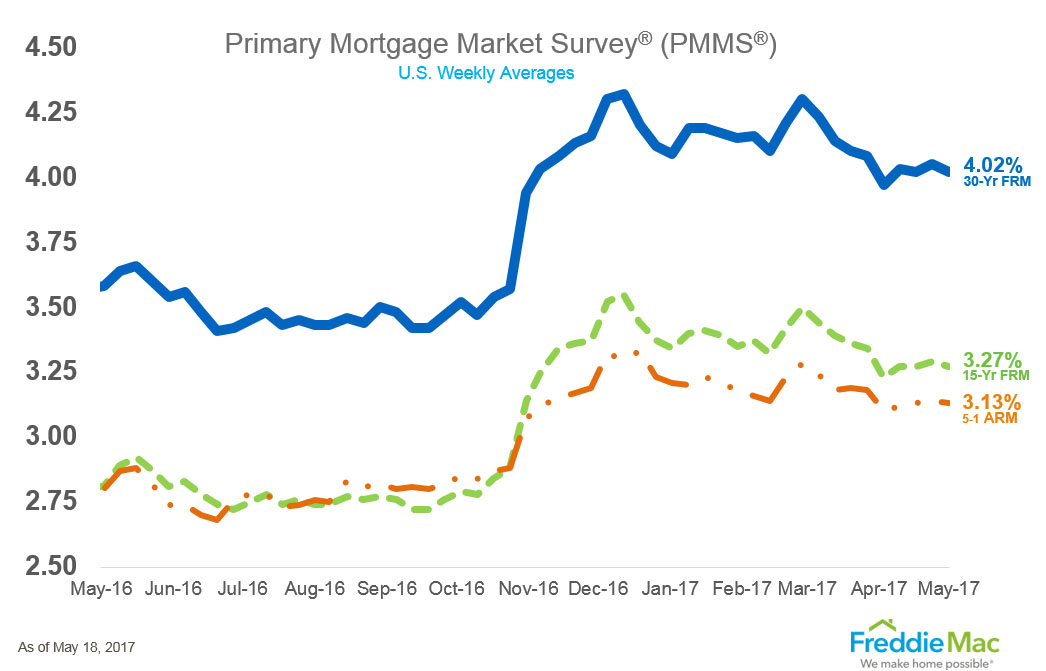
As can be seen from Freddie Mac’s Mortgage Market Survey, last week, 30 Yr. Fixed Mortgage rates for conforming loans hit 4.02% just in time for the Spring home-buying season.
Treasury Prices Rise and Yields Fall for U.S. 10 Yr. and 30 Yr. Treasuries.
On the Chicago Board of Trade (CBOT): the US 10 Year Treasury Note futures Contract for June settlement closed at a price of 126’06 / 32nds; the 10 Year Note was down 0.3 basis points (bps) on the day, yielding 2.2346%. The US 30 Year Treasury Bond futures Contract for June settlement closed at a price of 153’27 / 32nds; the 30 Year Bond was up 1 basis points (bps) on the day, yielding 2.8966%. Mortgage Rates were little changed on the day from the previous trading session.
Thanks to ZeroHedge.com and FreddieMac.com for Charts and Graphics.
ERATE's Daily Rate Summary
May 16, 2017
Mortgage Rates Steady Treasury Yields Rise.
On Monday, Treasury yields and Mortgage Rates were unchanged after the six weeks of lower yields to usher in the spring home-buying season. Credit markets have paused and the six week rally in bonds & lower mortgage interest rates has consolidated. The 10 Yr. U.S. Treasury Note stood at a yield of 2.3433% and the 30 Yr. U.S. Treasury Bond yielded 3.0064%. 30 Year Mortgages according to Freddie Mac were around 4.05% for conforming and 4.46% for Jumbo products.

For now, the improvement in mortgage rates post Fed has come to a halt, with the Fed increasingly sticking to its commitment to gradual increases to the Federal Funds rate at the June meeting. The door is still open for mortgage refinancing & home purchases as Mortgage rate continue to stay at low levels. As I wrote in previous missives, the U.S. Bond market is serenely calm as to the future Debt Ceiling negotiations, Interest Rate increases, and signs of Inflation (they had that covered by punting until September fiscal year end).
30 Year Treasury Yields Have Risen Above 3.00% (Courtesy of Zerohedge.com)
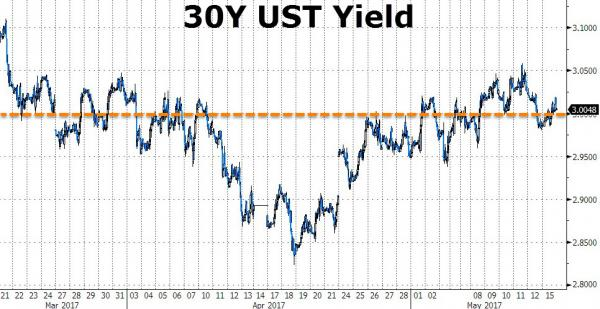
30 Year Treasury Bond yields have been falling consistently since the March 15th meeting by the Federal Reserve and its decision to hike the Federal Funds Rate by 0.25%. The benchmark yield now stands just above 3.000%.
June Rate Hike Odds Rise to 68% (Chart courtesy of Zerohedge.com).
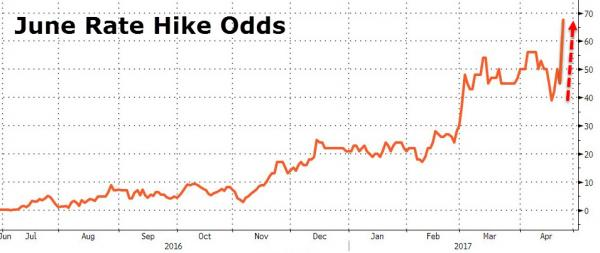
As displayed in the Chart, the odds of a June rate hike by the Federal Reserve have been volatile during the past few weeks oscillating between 68% and 37%. The market is discounting the Fed's commitment to its espoused path of tightening in the Federal Funds rate, even though its own updated Implied Fed Funds Target Rate (Dot Plot) still shows two or three increase in 2017.
If the long end of the Treasury yield curve refuses to rise even with 2 or 3 scheduled rate hikes its telling the Fed that rates are too high for the anticipated growth rate for the economy or the fall in commodity prices is telegraphing weakness in inflation expectations ahead. Either way, higher long term interest rates may not last out the year.
Implied Fed Funds Target Rate (Dot Plot)
(Chart courtesy of Zerohedge.com).
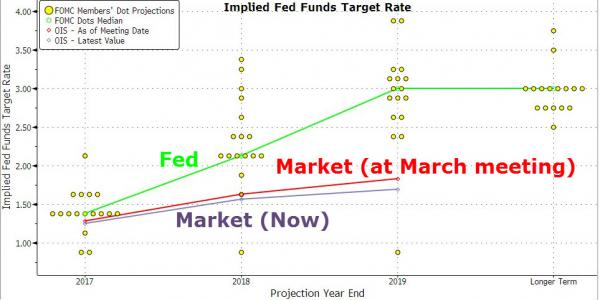
The so-called Dot Plot suggests that the Fed Funds Rate will be 1.75% by the end of 2017 which indicated two additional rate hikes this year.
Federal Reserve Market Implied # of Rate Hikes for 2017 (Chart courtesy of Zerohedge.com).
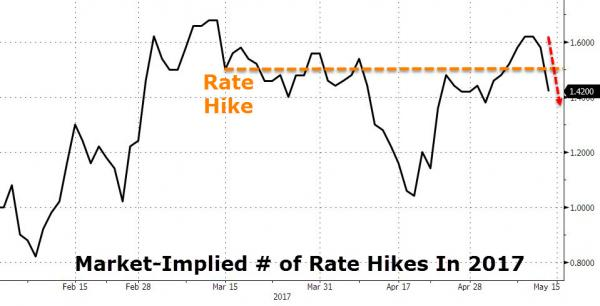
The Federal Reserve's current Market Implied # of Rate Hikes for 2017 has fallen recently to 1.42 from 1.60 two weeks ago; suggesting that macro-economic conditions are worsening somewhat recently and maybe not all the intended Fed Rate Hikes in 2017 (see dot plot) will be cashiered.
Weekly Mortgage Rates Analysis
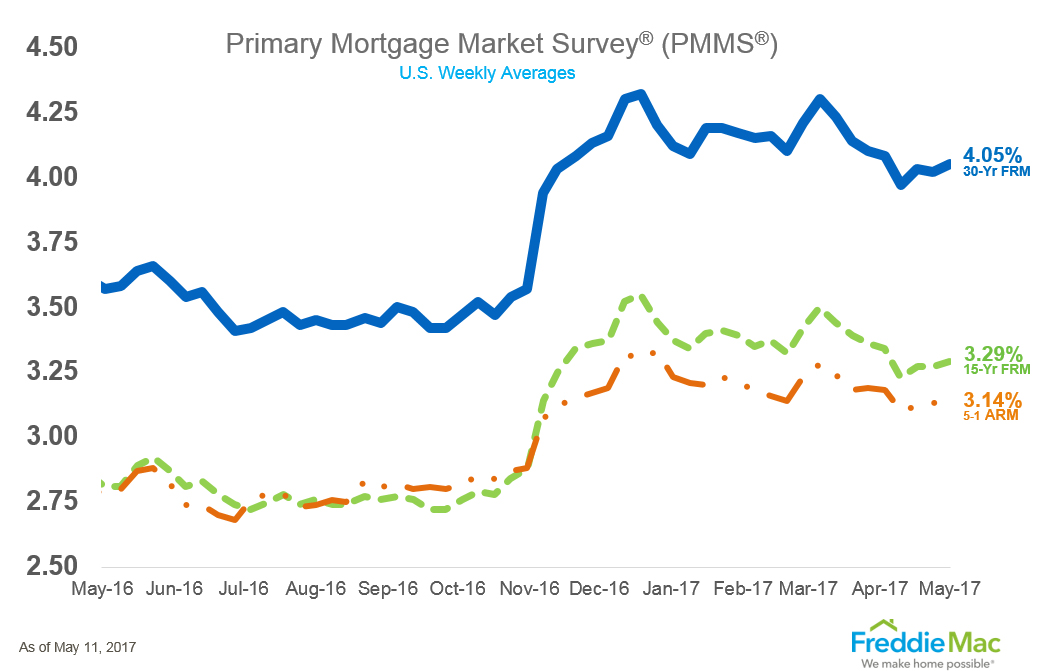
As can be seen from Freddie Mac's Mortgage Market Survey, last week, 30 Yr. Fixed Mortgage rates for conforming loans hit 4.05% just in time for the Spring home-buying season.
Treasury Prices Rise and Yields Fall for U.S. 10 Yr. and 30 Yr. Treasuries.
On the Chicago Board of Trade (CBOT): the US 10 Year Treasury Note futures Contract for June settlement closed at a price of 125'14.5 / 32nds; the 10 Year Note was down 0.5 basis points (bps) on the day, yielding 2.3433%. The US 30 Year Treasury Bond futures Contract for June settlement closed at a price of 151'09 / 32nds; the 30 Year Bond was down 5 basis points (bps) on the day, yielding 3.0064%. Mortgage Rates were little changed on the day from the previous trading session.
Thanks to ZeroHedge.com and FreddieMac.com for Charts and Graphics.
ERATE's Daily Rate Summary
May 09, 2017
Mortgage Rates Steady Treasury Yields Rise.
On Monday, Treasury yields rose and Mortgage Rates were steady after the six weeks of lower yields to usher in the spring home-buying season. Credit markets have paused and the six week rally in bonds & lower mortgage interest rates has come to an end. The 10 Yr. U.S. Treasury Note stood at a yield of 2.3868% and the 30 Yr. U.S. Treasury Bond yielded 3.0222%. 30 Year Mortgages according to Freddie Mac were around 4.02% for conforming and 4.44% for Jumbo products.

For now, the improvement in mortgage rates post Fed has come to a halt, with the Fed increasingly sticking to its commitment to gradual increases to the Federal Funds rate at the June meeting. The problem as I see it is that the wave of refinancing last fall leading up to the election has left the creditors with a dearth of potential borrowers at prevailing rates. Would be borrowers still remembering the rock-bottom rate in effect in September. What would stimulate another wave of demand in refinancings is a gimic. Why don't the powers-that-be bring back the Assumable Mortgage? Then borrowers would have a “sweetener” to add to any deal in the future home resale or property transfer. What about making 40 year or 50 year mortgages the standard to help affordability (especially in California) where price have shot out of sight for most new potential buyers? All things that make you go, hmmmm! As I wrote in previous missives, the U.S. Bond market is serenely calm as to the future Debt Ceiling negotiations, Interest Rate increases, and signs of Inflation (they had that covered by punting until September fiscal year end).
30 Year Treasury Yields Have Risen Above 3.00% (Courtesy of Zerohedge.com)
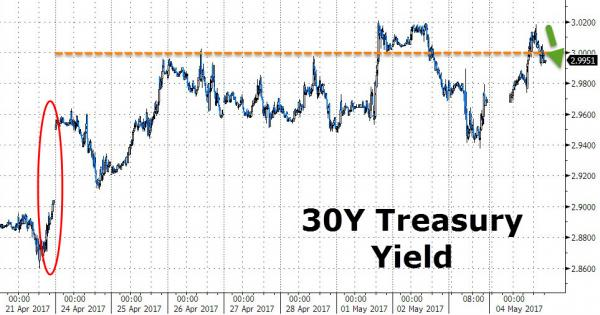
30 Year Treasury Bond yields have been falling consistently since the March 15th meeting by the Federal Reserve and its decision to hike the Federal Funds Rate by 0.25%. The benchmark yield now stands just above 3.000%.
June Rate Hike Odds Rise to 68% (Chart courtesy of Zerohedge.com).
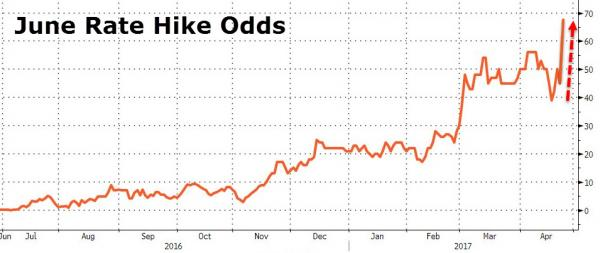
As displayed in the Chart, the odds of a June rate hike by the Federal Reserve have been volatile during the past few weeks oscillating between 68% and 37%. The market is discounting the Fed's commitment to its espoused path of tightening in the Federal Funds rate, even though its own updated Implied Fed Funds Target Rate (Dot Plot) still shows two or three increase in 2017.
If the long end of the Treasury yield curve refuses to rise even with 2 or 3 scheduled rate hikes its telling the Fed that rates are too high for the anticipated growth rate for the economy or the fall in commodity prices is telegraphing weakness in inflation expectations ahead. Either way, higher long term interest rates may not last out the year.
Implied Fed Funds Target Rate (Dot Plot)
(Chart courtesy of Zerohedge.com).
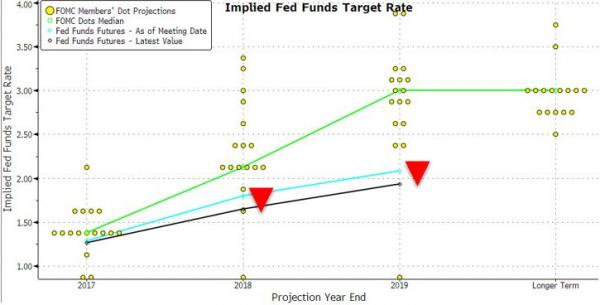
The so-called Dot Plot suggests that the Fed Funds Rate will be 1.75% by the end of 2017 which indicated two additional rate hikes this year.
U.S. 30 Year Treasury Bond Yields (Chart courtesy of Zerohedge.com).
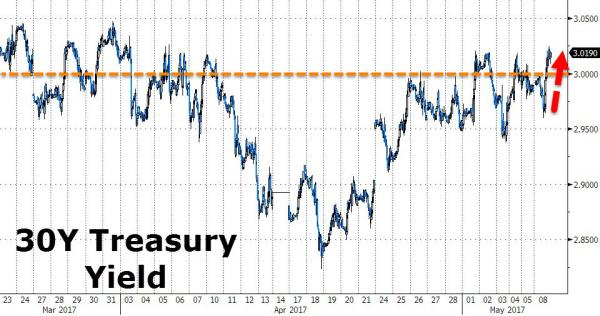
The 30 Year Treasury Note has now retraced over 20 bps in yields since the low on April 18th. Some bad news on the economic front would be greatly appreciated about right now…then we could get rates back into the 3's and see some borrowers come out of the woodwork.
Weekly Mortgage Rates Analysis
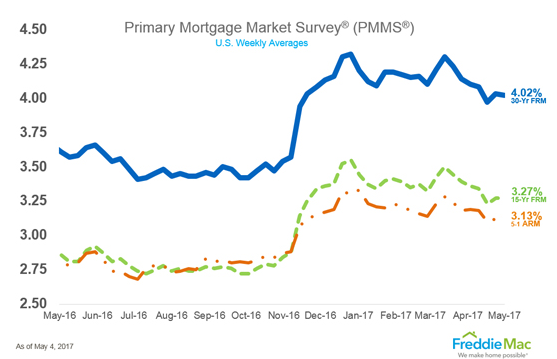
As can be seen from Freddie Mac's Mortgage Market Survey, last week, 30 Yr. Fixed Mortgage rates for conforming loans hit 4.02% just in time for the Spring home-buying season.
Treasury Prices Rise and Yields Fall for U.S. 10 Yr. and 30 Yr. Treasuries.
On the Chicago Board of Trade (CBOT): the US 10 Year Treasury Note futures Contract for June settlement closed at a price of 124'26.5 / 32nds; the 10 Year Note was down 7.5 basis points (bps) on the day, yielding 2.3868%. The US 30 Year Treasury Bond futures Contract for June settlement closed at a price of 150'24 / 32nds; the 30 Year Bond was down 18 basis points (bps) on the day, yielding 3.0222%. Mortgage Rates were unchanged on the day from the previous trading session.
Thanks to ZeroHedge.com and FreddieMac.com for Charts and Graphics.
ERATE's Daily Rate Summary
April 25, 2017
Rally Continues in Treasury Yields & Mortgage Rates.
On Monday, Treasury yields and Mortgage Rates were consolidating gains after the six weeks of lower yields to usher in the spring home-buying season. This is now six weeks in a row of lower interest rates, engineered by a Fed that had no less than 5 Fed governors go out on the speaking trail and say; "no…we are really serious about raising interest rates and normalizing our balance sheet, we're not kidding". Instead, from mid-March thru April the 10 Year Note yield has instead fallen over 50 bps in that time. On Monday, the 10 Yr. U.S. Treasury Note stood at a yield of 2.2730% and the 30 Yr. U.S. Treasury Bond yielded 2.9288%. Previous week, 30 Year Mortgages according to Freddie Mac were around 3.97% for conforming and 4.39% for Jumbo products.

Post Fed the whole U.S. Treasury yield curve is still flattening in response to last month's anticipated Federal Reserve rate move. Long dated Treasuries are being strongly bid up as investors seek a bargain in the higher yields that occurred in the run-up to the Fed meeting. The U.S. Bond market is serenely calm as to the future Debt Ceiling negotiations, Interest Rate increases, and signs that Inflation is heating up.
30 Year Treasury Yields Have Fallen Below 3.00% (Courtesy of Zerohedge.com)
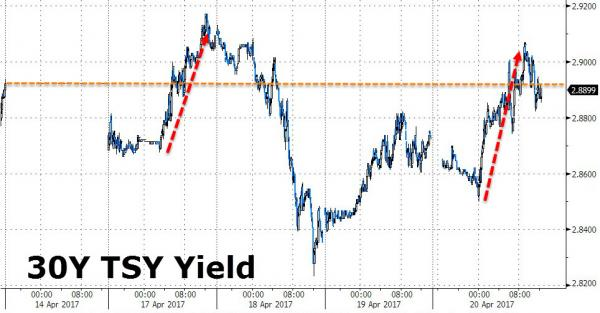
30 Year Treasury Bond yields have been falling consistently since the March 15th meeting by the Federal Reserve and its decision to hike the Federal Funds Rate by 0.25%. The benchmark yield now stands below 3.000%.
June Rate Hike Odds Rise to 68% (Chart courtesy of Zerohedge.com).
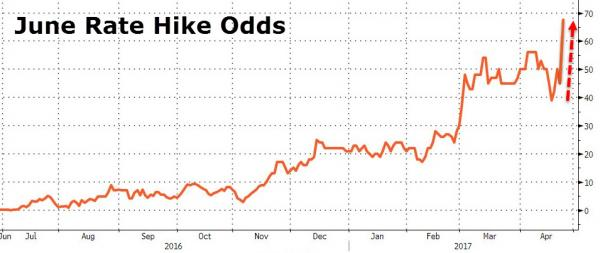
As displayed in the Chart, the odds of a June rate hike by the Federal Reserve have been volatile during the past few weeks oscillating between 68% and 37%. The market is discounting the Fed's commitment to its espoused path of tightening in the Federal Funds rate, even though its own updated Implied Fed Funds Target Rate (Dot Plot) still shows two or three increase in 2017.
Implied Fed Funds Target Rate (Dot Plot)
(Chart courtesy of Zerohedge.com).
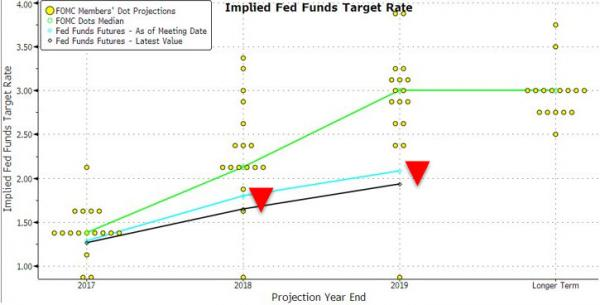
The so-called Dot Plot suggests that the Fed Funds Rate will be 1.75% by the end of 2017 which indicated two additional rate hikes this year.
U.S. 10 Year Treasury Note Yields are Falling
(Chart courtesy of Zerohedge.com).
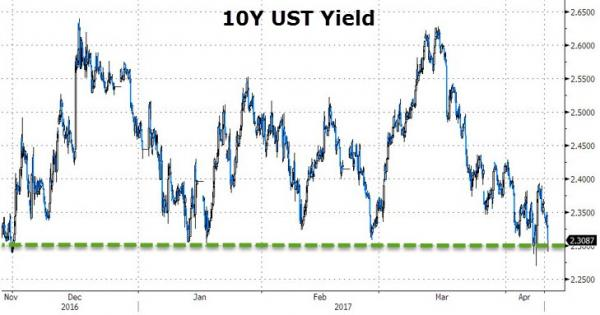
The 10 Year Treasury Note is now over 36 bps lower than at the time just before the Fed's last meeting in March, this would seem to be counter-intuitive to the proposed path of interest rates, but suggests a correction was in order due to everyone believing rates were only going to rise.
Weekly Mortgage Rates Analysis
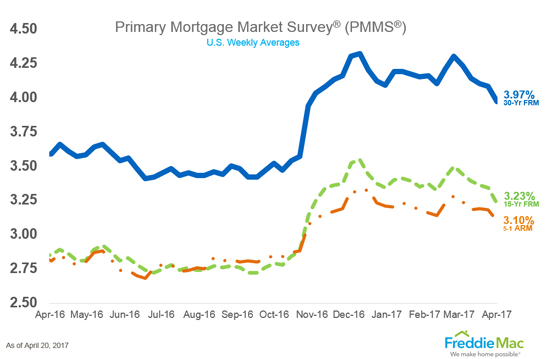
As can be seen from Freddie Mac's Mortgage Market Survey, last week, 30 Yr. Fixed Mortgage rates for conforming loans hit 3.97% just in time for the Spring home-buying season.
Treasury Prices Rise and Yields Fall for U.S. 10 Yr. and 30 Yr. Treasuries.
On the Chicago Board of Trade (CBOT): the US 10 Year Treasury Note futures Contract for June settlement closed at a price of 125'25.5 / 32nds; the 10 Year Note was down 8.5 basis points (bps) on the day, yielding 2.2730%. The US 30 Year Treasury Bond futures Contract for June settlement closed at a price of 153'14 / 32nds; the 30 Year Bond was down 23 basis points (bps) on the day, yielding 2.9288%. Mortgage Rates were unchanged on the day from the previous trading session.
Thanks to ZeroHedge.com and FreddieMac.com for Charts and Graphics.
ERATE's Daily Rate Summary
April 10, 2017
Rally Continues in Treasury Yields & Mortgage Rates.
On Monday, Treasury yields and Mortgage Rates continue their rally post fed rate hike. This is now five days in a row of better pricing when compared to previous trading. On Tuesday, the 10 Yr. U.S. Treasury Note yielded 2.3661% and the 30 Yr. U.S. Treasury Bond yielded 2.9903%. Previous week, 30 Year Mortgages according to Freddie Mac were around 4.10% for conforming and 4.49% for Jumbo products.

Post Fed the whole U.S. Treasury yield curve is flattening in response to last Wednesday's expected Federal Reserve rate move. Long dated Treasuries are being strongly bid up as investors see a bargain in the higher yields that occurred in the run-up to the Fed meeting. The Bond market is acting unfazed by future Debt Ceiling negotiations, Interest Rate increases, and signs that Inflation is heating up (see chart below).
30 Year Treasury Yields Have Fallen Below 3.00% (Courtesy of Zerohedge.com)
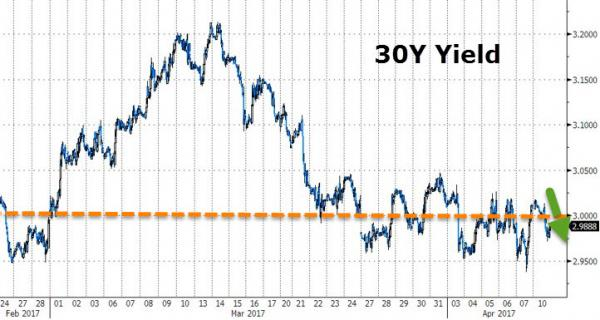
30 Year Treasury Bond yields have been falling consistently since the March 15th meeting by the Federal Reserve and its decision to hike the Federal Funds Rate by 0.25%. The benchmark yield now stands below 3.000%.
June Rate Hike Odds Fall to 37%
(Chart courtesy of Zerohedge.com).
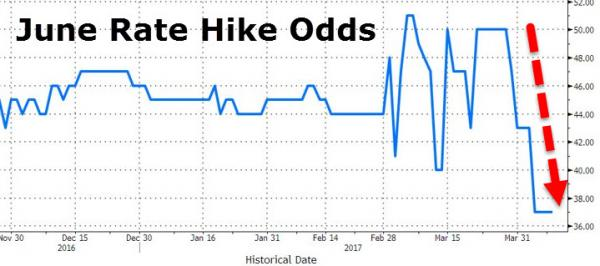
As displayed in the Chart, the odds of a June Rate Hike by the Federal Reserve have been volatile during the past few weeks oscillating between 50% and 37%. The market is dis-believing of the Fed's commitment to a gradual pace of tightening in the Federal Funds rate, even though its own updated Implied Fed Funds Target Rate (Dot Plot) still shows two or three increase in 2017.
Implied Fed Funds Target Rate (Dot Plot)
(Chart courtesy of Zerohedge.com).
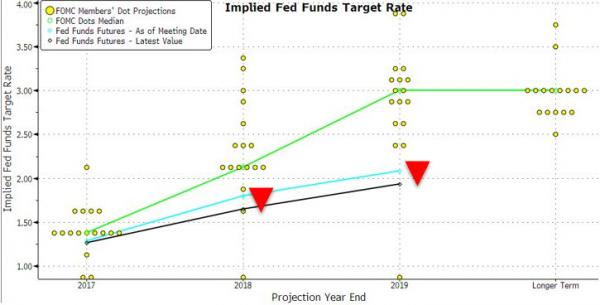
The so-called Dot Plot suggests that the Fed Funds Rate will be 1.75% by the end of 2017 which indicated two additional rate hikes this year.
U.S. 10 Year Treasury Note Yields are Falling
(Chart courtesy of Zerohedge.com).
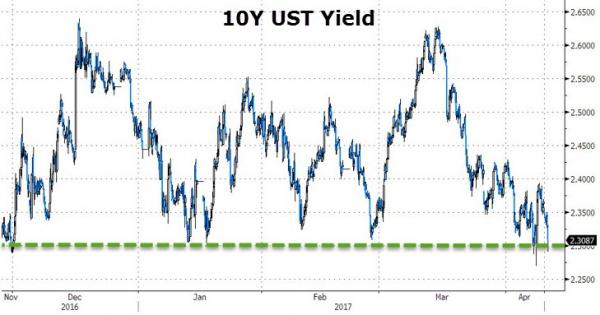
The 10 Year Treasury Note is now over 30 bps lower than at the time just before the Fed's last meeting in March, this would seem to be counter-intuitive to the proposed path of interest rates, but suggests a correction was in order due to a crowded trade.
Weekly Mortgage Rates Analysis
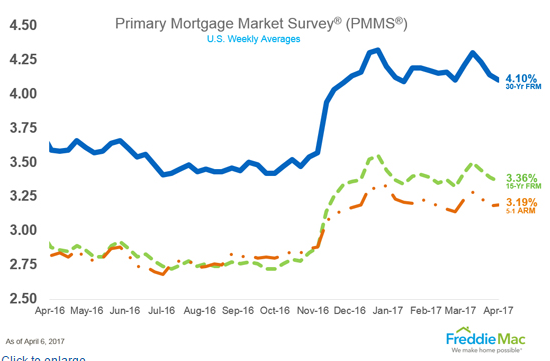
As can be seen from Freddie Mac's Mortgage Market Survey, last week, 30 Yr. Fixed Mortgage rates for conforming loans hit 4.100% due to dovish Fed Governor comments about the pace of future rate hike and possible pause for balance sheet reductions.
Treasury Prices Rise and Yields Fall for U.S. 10 Yr. and 30 Yr. Treasuries.
On the Chicago Board of Trade (CBOT): the US 10 Year Treasury Note futures Contract for June settlement closed at a price of 124'29 / 32nds; the 10 Year Note was up 3 basis points (bps) on the day, yielding 2.3661%. The US 30 Year Treasury Bond futures Contract for June settlement closed at a price of 151'25 / 32nds; the 30 Year Bond was up 9 basis points (bps) on the day, yielding 2.9903%. Mortgage Rates were lower on the day from the previous trading session.
Thanks to ZeroHedge.com and FreddieMac.com for Charts and Graphics.
ERATE's Daily Rate Summary
March 21, 2017
Fed Hikes FF Rate and Treasuries Yields & Mortgage Rates Fall.
On Monday, Treasury yields and Mortgage Rates continue their rally post fed rate hike. This is now four days in a row of better pricing when compared to previous trading. On Monday, the 10 Yr. U.S. Treasury Note yielded 2.4607% and the 30 Yr. U.S. Treasury Bond yielded 3.0770%. Previous week, 30 Year Mortgages according to Freddie Mac were around 4.30% for conforming and 4.63% for Jumbo products.

Post Fed the whole U.S. Treasury yield curve is falling in response to last Wednesday's expected Federal Reserve rate move. Treasuries are being strongly bid up as bargain seekers look to lock in the higher yields that occurred in the run-up to the Fed meeting. The Bond market is acting unfazed by both the upcoming Debt Ceiling negotiations and Fed policymakers' communication post-fed meeting of future rate hikes (see dot plot).
U.S. 30 Yr. Bond Yield (Last five days)
(Chart courtesy of Zerohedge.com).
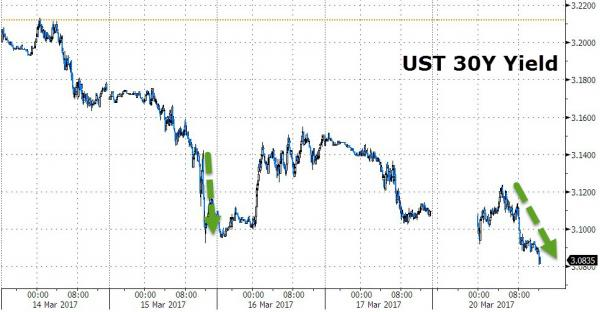
Weekly Mortgage Rates Analysis
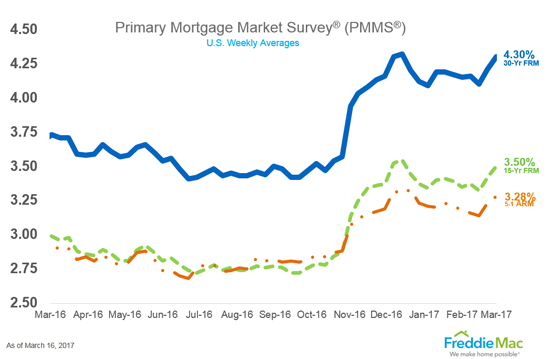
As can be seen from Freddie Mac's Mortgage Market Survey, last week, 30 Yr. Fixed Mortgage rates for conforming loans hit 4.300% due to investor fears of Fed hawkishness but have now retreated due to a more dovish outlook post-Fed meeting.
Implied Fed Funds Target Rate
(Chart courtesy of Zerohedge.com).
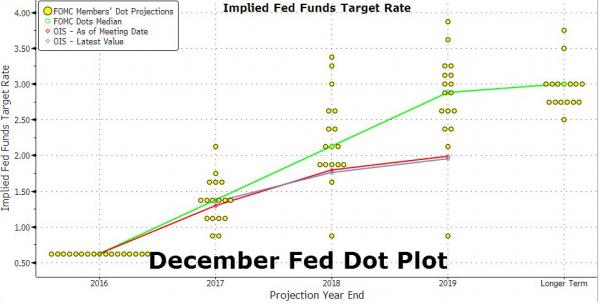
What the Fed has now told the market is to expect a more gradual increase in the Fed Funds Target Rate to 2.00% by the end of 2018 and for the longer term (beyond 2020) 3.00% eventually. They are assuming that the pace of job creation will continue, with no economic recession, and that their forecast for future growth in the economy is above the inflation rate, and Federal Reserve Monetary policy stance continues to be accommodative (see dot plot above). Q1 GDP is due in two weeks.
Fed Funds Target Rate: A Historical Perspective.
(Chart courtesy of Zerohedge.com).
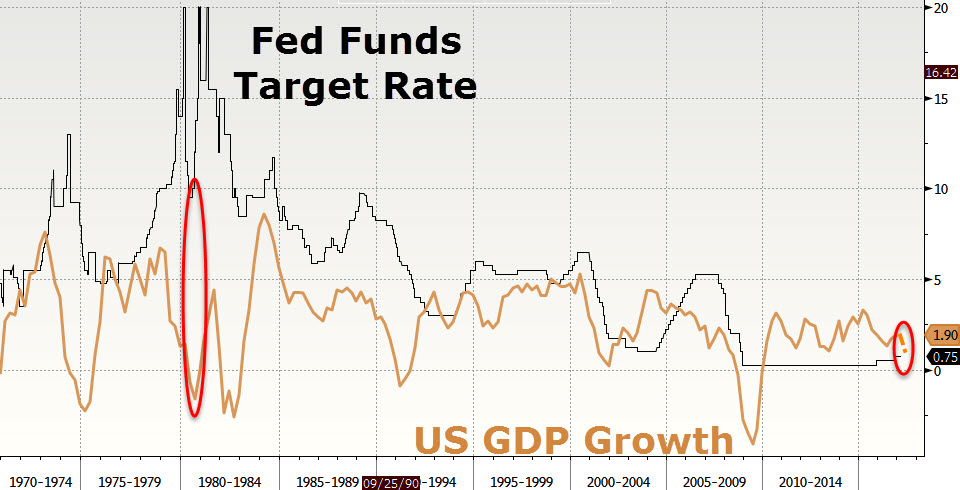
If Q1 Gross Domestic Product is as weak as the Atlanta Federal Reserve's GDPnow forecast of 0.9% then the Fed may need to pare back its projected path of future rate increases from three to something less. This is what the market is wishing for with its strong bid for U.S. Treasuries post fed meeting. If inflation goes and stays above the Fed target of 2.00% and GDP growth slips to under 1.00% then we have a potential stag-flationary environment (rising inflation and low growth).
Treasury Prices Rise and Yields Fall for U.S. 10 Yr. and 30 Yr. Treasuries.
On the Chicago Board of Trade (CBOT): the US 10 Year Treasury Note futures Contract for June settlement closed at a price of 124'00 / 32nds; the 10 Year Note was up 8 basis points (bps) on the day, yielding 2.4607%. The US 30 Year Treasury Bond futures Contract for June settlement closed at a price of 149'00 / 32nds; the 30 Year Bond was up 18 basis points (bps) on the day, yielding 3.0770%. Mortgage Rates were lower on the day from the previous trading session.
Thanks to ZeroHedge.com, FreddieMac.com and Bloomberg.com for Charts and Graphics.
ERATE's Daily Rate Summary
March 16, 2017
Fed Hikes FF Rate and Treasuries Yields & Mortgage Rates Fall.
On Wednesday, the Federal Reserve increased the Fed Funds Rate by 0.25% bps to 1.00% as was expected and U.S. Treasury prices and Mortgage rates fell as a bond buying rally commenced. Starting the moment the press release hit the wires Wednesday, yields fell dramatically for 10 Yr. & 30 Yr. Treasuries, as well as Mortgage Rates, when compared to Tuesday's trading range. On Wednesday, the 10 Yr. U.S. Treasury Note yielded 2.4930% and the 30 Yr. U.S. Treasury Bond yielded 3.1071%. This week, 30 Year Mortgages according to Freddie Mac were around 4.21% for conforming and 4.69% for Jumbo products.

While the whole U.S. Treasury yield curve fell in response to Wednesday's expected Federal Reserve rate move when it was announced; a series future Interest Rates hikes (although gradual) are baked into the cake. Fed policymakers' projections (see dot plot) could suggest four rate hikes this year instead of the three projected in December.
U.S. 10 Yr. Note Yield (Dec 2015 to Present)
(Chart courtesy of Zerohedge.com).
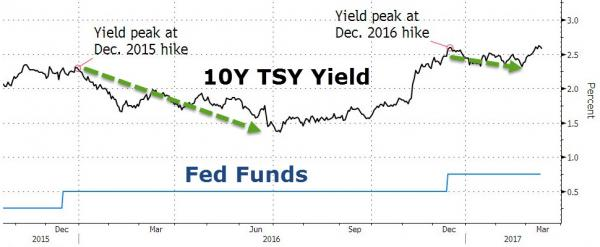
As can be seen from the Chart the U.S. 10 Yr. Note is sitting at a critical place right now with a yield of 2.500%. Because mortgage rates are tied most closely with the U.S. 10 Yr. Treasury Note, which way this goes will be important for borrowers seeking 30 Yr. Fixed Rate mortgages which now stand at 4.21%.
Implied Fed Funds Target Rate
(Chart courtesy of Zerohedge.com).
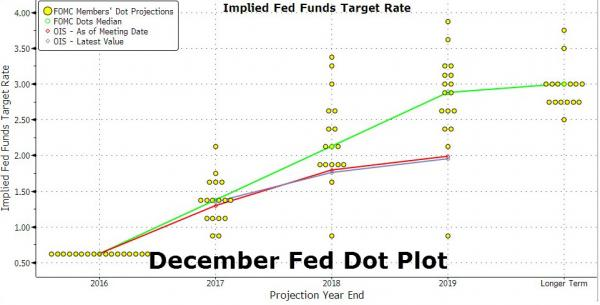
What the Fed has now told the market is to expect a gradual increase in the Fed Funds Target Rate to 2.00% by the end of 2018 and for the longer term (beyond 2020) 3.00% eventually. They are assuming that no economic recession will happen between then and now (even with the Atlanta GDPnow Q1 2017 GDP forecast having fallen to just 0.9%) to interrupt the narrative that economic recovery is firmly in place (se3e dot plot above). This will be a tall order. We could easily see this plan derailed by events.
Fed Funds Target Rate: A Historical Perspective.
(Chart courtesy of Zerohedge.com).
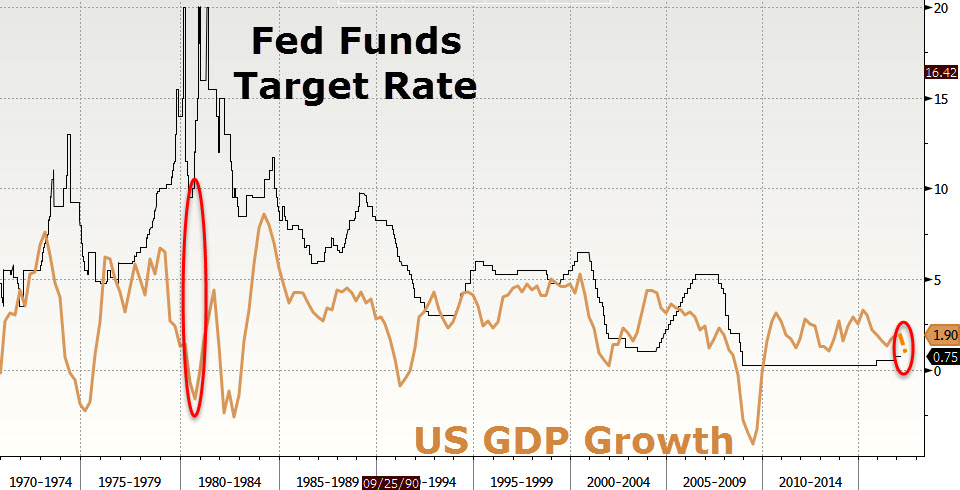
With all the hand wringing about the Fed raising the Fed Funds Target Rate by a 0.25% yesterday, it is always useful to see where we are from a historical perspective. As can be seen from the chart above, US GDP Growth is in secular decline over many decades. It certainly appears that Monetary Policy is having diminishing effectiveness in stimulating US Economic activity at the margin and after having been at the 'zero bound' condition for many years the Fed has decided to "stop digging" and find another way to get out of the hole we are in. We are setting up for a breakout in interest rates (normalization), because as Albert Einstein has so eloquently said, "Insanity is doing the same thing over and over but expecting a different outcome." The Federal Reserve has finally awakened and realized that ZIRP and NIRP don't work and haven't been working over the last 8 years.
Treasury Prices Rise and Yields Fall for U.S. 10 Yr. and 30 Yr. Treasuries.
On the Chicago Board of Trade (CBOT): the US 10 Year Treasury Note futures Contract for June settlement closed at a price of 123'23.5 / 32nds; the 10 Year Note was up 27.5 basis points (bps) on the day, yielding 2.4930%. The US 30 Year Treasury Bond futures Contract for June settlement closed at a price of 148'09 / 32nds; the 30 Year Bond was up 1'14 basis points (bps) on the day, yielding 3.1071%. Mortgage Rates were much lower on the day from the previous trading session.
Thanks to ZeroHedge.com and Bloomberg.com for Charts and Graphics.
ERATE's Daily Rate Summary
March 14, 2017
Treasuries & Mortgage Rates Quiet on Monday as Traders Wait on Fed.
U.S. Treasury prices and Mortgage Rates were little changed as traders wait on Federal Reserve Wednesday announcement. Monday's price action was lower with yields higher for 10 Yr. & 30 Yr. Treasuries, as well as Mortgage Rates, when compared to Friday's trading range. According to Reuter's, "Markets are staying relatively quiet in front of the Fed," said Lou Brien, market strategist at DRW Trading in Chicago. He said weakness in riskier U.S. stocks also stoked demand for safe-haven U.S. Treasuries. On Monday, the 10 Yr. U.S. Treasury Note yielded 2.607% and the 30 Yr. U.S. Treasury Bond yielded 3.192%.

Implied Fed Funds Target Rate
(Chart courtesy of Zerohedge.com).
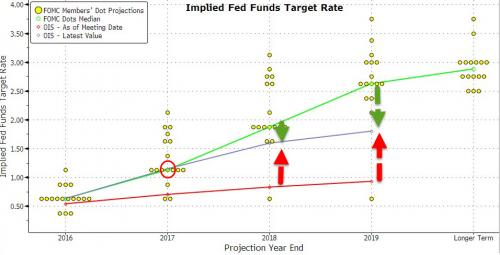
The U.S. Federal Reserve is set to meet on Tuesday and Wednesday to discuss Interest Rates at its March meeting and raise the Fed Funds Interest rate for only the third time in the last decade. The rate is increasing 0.25% bps and is going from 0.75% to 1.00% and Fed policymakers' projections could suggest four rate hikes this year instead of the three projected in December, said Ellis Phifer, market strategist at Raymond James in Memphis, Tennessee. Recently, 30 Year Mortgages according to Freddie Mac were around 4.21% for conforming and 4.69% for Jumbo products.
Freddie Mac Weekly Survey for Mortgage Rates Increases slightly on Week.
(Chart courtesy of FreddieMac.com).
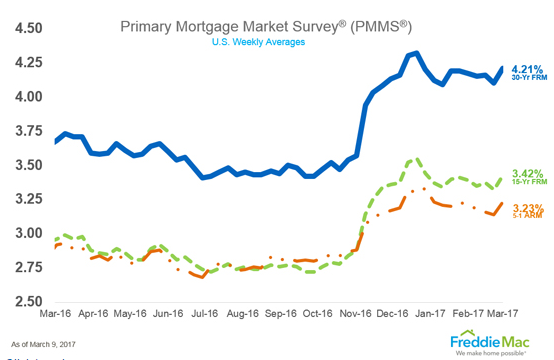
U.S. 10 Yr. Note Yield (Dec 2016 to Present)
(Chart courtesy of Bloomberg Finance L.P.).
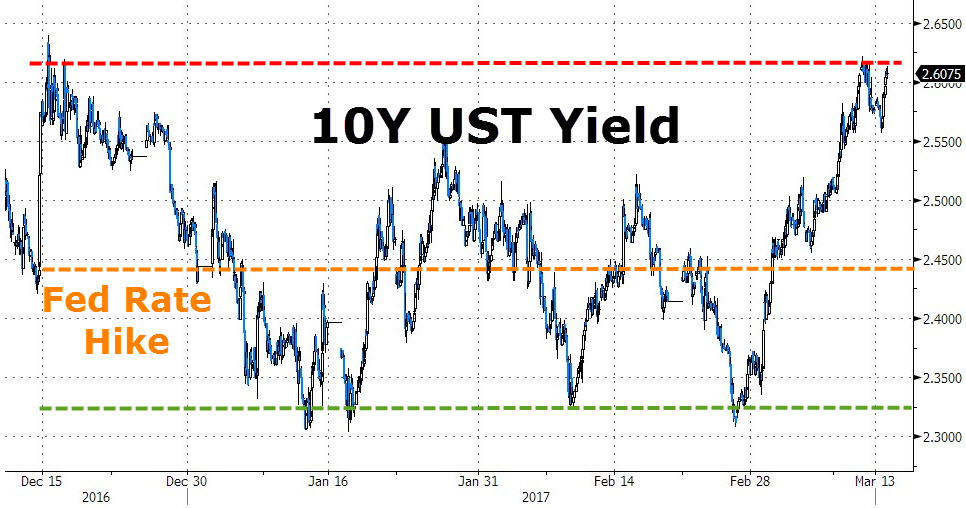
As can be seen from the Chart the U.S. 10 Yr. Note is sitting at a critical place right now with a yield of 2.6075%. Because mortgage rates are tied most closely with the 10 Yr. Note, which way this goes will be important for borrowers seeking 30 Yr. Fixed Rate mortgages now sitting at 4.21%. What the Fed has to say in its post-meeting communication and subsequent minutes will give insight to the path of future tightening moves the (dot plot).
June Rate Hike Odds are increasing to over 50% As Traders price in the next move.
(Chart courtesy of Zerohedge.com).
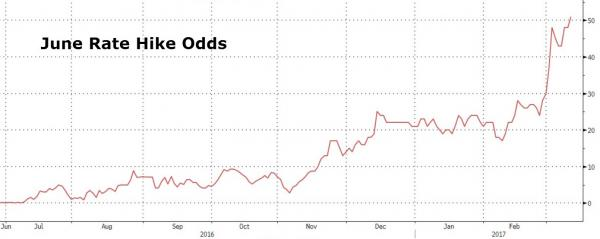
As can been seen from the Chart above, the Odds of another Interest Rate Hike by the Federal Reserve at its June meeting are already starting to increase as well even though the March Fed meeting (Odds are over 92%) hasn't yet taken place.
Treasury Prices Fall and Yields Rise for U.S. 10 Yr. and 30 Yr. Treasuries.
On the Chicago Board of Trade (CBOT): the US 10 Year Treasury Note futures Contract for June settlement closed at a price of 122'25.5 / 32nds; the 10 Year Note was down 7 basis points (bps) on the day, yielding 2.60%. The US 30 Year Treasury Bond futures Contract for June settlement closed at a price of 146'12 / 32nds; the 30 Year Bond was down 15 basis points (bps) on the day, yielding 3.19%. Mortgage Rates were unchanged on the day from the previous trading session.
Thanks to ZeroHedge.com and FreddieMac.com for Charts and Graphics.
ERATE's Daily Rate Summary
March 13, 2017
Treasuries & Mortgage Rates Unchanged by February Jobs Report.
U.S. Treasury prices and Mortgage Rates seemed un-phased by Friday's BLS Jobs Report showing the economy added +235,000 in February, above highest expectations for +233,000 jobs. Friday's price action was flat to slightly higher for 10 Yr. & 30 Yr. Treasuries, as well as Mortgage Rates, when compared to Thursday's trading range. This suggests that the news was already priced into debt securities in the run-up in the last five trading days. On Friday, the 10 Yr. U.S. Treasury Note yielded 2.577% and the 30 Yr. U.S. Treasury Bond yielded 3.164%.

U.S. Federal Funds Rate Set to Raise +0.25% to 1.00% on Wednesday.
(Chart courtesy of Zerohedge.com).
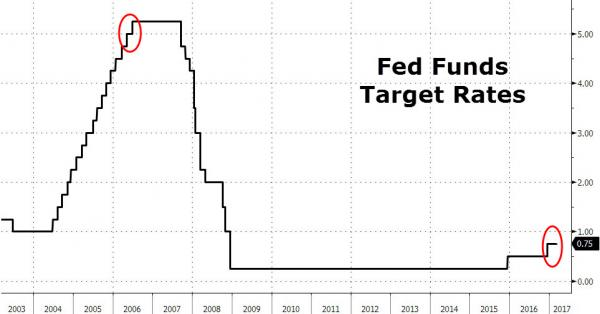
The U.S. Federal Reserve is set to meet on Tuesday and Wednesday to discuss Interest Rates at its March meeting and raise the Fed Funds Interest rate for only the third time in the last decade. The rate is increasing 0.25% bps and is going from 0.75% to 1.00% and is expected to impact all other Interest rates including those for Credit Cards and Home Mortgages. Recently, 30 Year Mortgages according to Freddie Mac were around 4.21% for conforming and 4.69% for Jumbo products.
Freddie Mac Weekly Survey for Mortgage Rates Increases slightly on Week.
(Chart courtesy of FreddieMac.com).
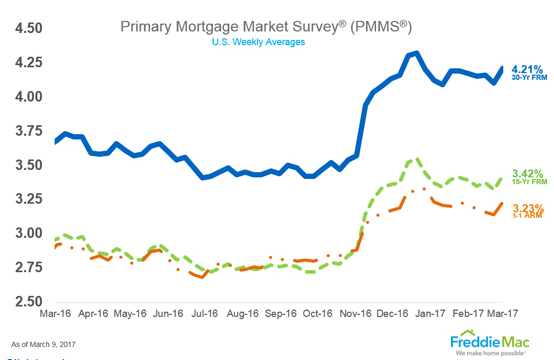
After consolidating for over two months, Mortgage Rate appear to be rising again as the Federal Reserve meets on March 14th and 15th to decide if economy is ready to begin an extended program of interest rate 'normalization' stretching into 2018 and beyond. The course of this plot of tightening has been telegraphed by its meeting minutes through the publication of a so called "Dot Plot" of targeted series of rate increase (see chart below).
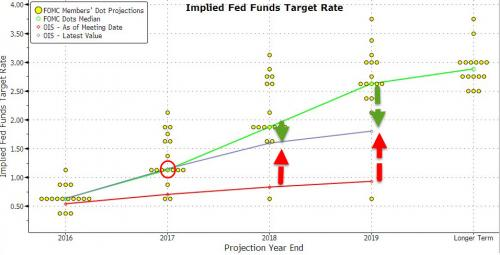
As Zerohedge.com Chart above illustrates where each voting member is in relation to the speed and rapidity of the projected course of those forecasted rate increases. As can be seen from the visual representation the Federal Reserve has fallen behind its forecast for Fed Funds Target Rate increases (green line) as the path it is on (red line) is far below what it has stated is the path of interest rate 'normalization'. Just last year it called for 3 rate increases and only delivered one rate increase in 2016. This year it again has forecast (telegraphed) 3 more increases in March, June, and September, as it works to get the Fed Funds Rate to 1.50% (purple line) by the end of 2017.
U.S. 10 Yr. Note Yield (2013 to Present
(Chart courtesy of Bloomberg Finance L.P.).
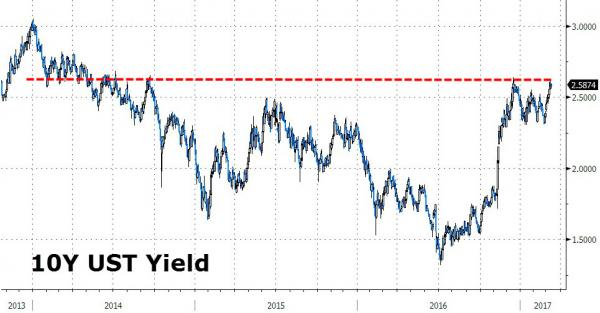
As can be seen from the Chart the U.S. 10 Yr. Note is sitting at a critical place right now with a yield of 2.5874%. Because mortgage rates are tied most closely with the 10 Yr. Note, which way this goes will be important for borrowers seeking 30 Yr. Fixed Rate mortgages now sitting at 4.21%. What the Fed has to say in its post-meeting communication and subsequent minutes will give insight to the path of future tightening moves the (dot plot).
U.S. Aggregate Treasury Futures Net Positioning (10Yr. Equivalents)
(Chart courtesy of Zerohedge.com).
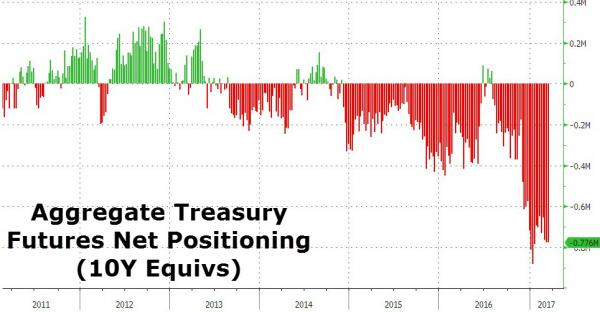
As the above graphic shows, Aggregate Treasury Futures Net Positioning (10 Yr. Equivalents) shows a lot of bearish bets being placed.
June Rate Hike Odds are increasing to over 50% As Traders price in the next move.
(Chart courtesy of Zerohedge.com).
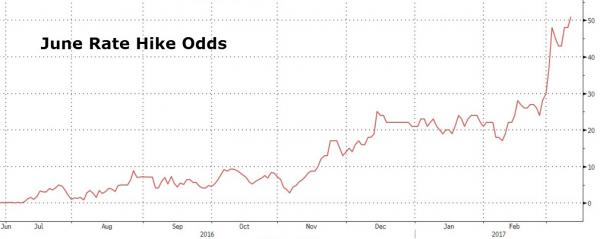
As can been seen from the Chart above, the Odds of another Interest Rate Hike by the Federal Reserve at its June meeting are already starting to increase as well even though the March Fed meeting (Odds are stuck at 100%) hasn't yet taken place.
Treasury Prices Fall and Yields Rise for U.S. 10 Yr. and 30 Yr. Treasuries.
On the Chicago Board of Trade (CBOT): the US 10 Year Treasury Note futures Contract for June settlement closed at a price of 123'00.5 / 32nds; the 10 Year Note was up 6 basis points (bps) on the day, yielding 2.58%. The US 30 Year Treasury Bond futures Contract for June settlement closed at a price of 146'27 / 32nds; the 30 Year Bond was up 1 basis points (bps) on the day, yielding 3.17%. Mortgage Rates were slightly lower on the day from the previous trading session.
Thanks to ZeroHedge.com and FreddieMac.com for Charts and Graphics.
ERATE's Daily Rate Summary
March 10, 2017
Treasuries & Mortgage Rates Un-Phased by February Jobs Report.
U.S. Treasury prices and Mortgage Rates seemed un-phased by Friday's BLS Jobs Report showing the economy added +235,000 in February, above highest expectations for +233,000 jobs. Friday's price action reflects an 'Inside day' for 10 Yr. & 30 Yr. Treasuries, as well as Mortgage Rates, when compared to Thursday's trading range. This suggests that the news was already priced into debt securities in the run-up in the last five trading days. On Thursday, the 10 Yr. U.S. Treasury Note yielded 2.59% and the 30 Yr. U.S. Treasury Bond yielded 3.18%.
U.S. Non-Farm Payrolls for February Rise by +235,000 Jobs, U.E. Rate Unchanged at 4.7%
(Chart courtesy of Zerohedge.com).
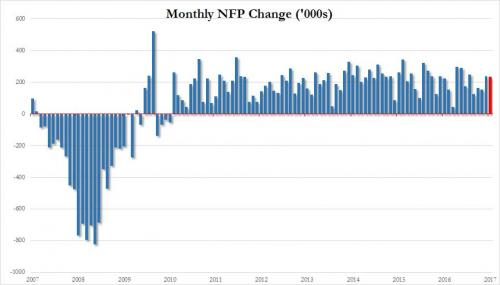
Manufacturing Jobs Increase by +28,000 in February (Chart courtesy of Zerohedge.com).
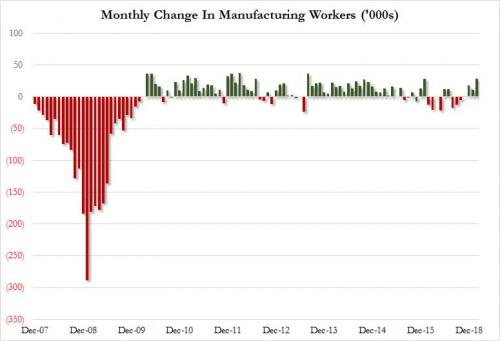
After a stretch of disappointing jobs reports in the middle of last year, Manufacturing jobs have again begun to rebound. Unfortunately, the long-term chart clearly demonstrates the 'new normal' that is todays U.S. Manufacturing Employment picture: The jobs lost (see red bars) during the "Great Recession" of 2008-2009 are not coming back or going to re-materialize for down-sized workers.
In the 'new normal', of the Globally Sourced Manufacturing economy; these jobs (green bars) are going to an entirely different group of globalized workers (these not the same people who lost the red jobs). Therefore, the 'phase change' in workforce composition, with all its concomitant issues for displaced workers re: the social safety net. These former employees have an established personal cost structure and established financial commitments to family, debt, and retirement. These new participants are mostly younger, with less experience, and with lower wages & productivity than the incumbents whose jobs that were lost in the downturn.
The demands of the competitive Global economy (labor cost arbitrage) and the 2008 Financial Crisis (financial engineering), gave the American Business establishment a green light to shed First World Labor arrangements & cost structures, -full-time, permanent work, compensation & benefits including health insurance (what the red bar workers had)- in favor of a new domestic regime of low wage & security jobs with no health insurance or benefits (green bars) to satisfy their overarching goal of maximum free-cash-flow for the C Suite masters of the Universe.
The historical 'social contract' between worker and employer is now gone. The reaction by workers is clearly seen in lower Labor Force Participation Rates by Age Group and the rise of so called gig or casual employment relationships. As can be seen in the Chart below, this occurrence pre-dates the 2008 Financial Crisis going back to the 2001 Dot Com bust.
U.S. Participation Rates by Age Group
(Chart courtesy of Bloomberg Finance L.P.).
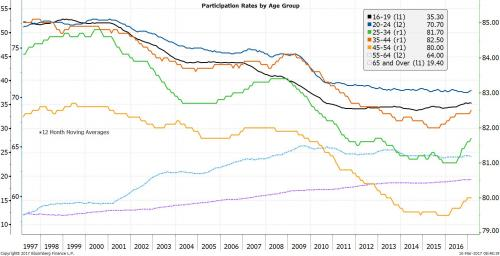
Because new hires are for the most part all young and just starting out… What the new cadre of workers has over the old cohort is much higher consumption ratio's, greater capacities for taking on new debt (for cars), more toys (iPhones), distractions (social media), and someday mortgage debt (for home purchases) if they can ever make enough in paid employment to reduce their high student debt levels to qualify, but this latter part is not working out quite so well as hoped. Once this cohort has completely monetized its income stream into maximum spending & debt they will be discarded by the business establishment as well. After all, it's the Farm Animal Market Economy model, don't you know!
U.S. Labor Force Participation Rate
(Chart courtesy of Zerohedge.com).
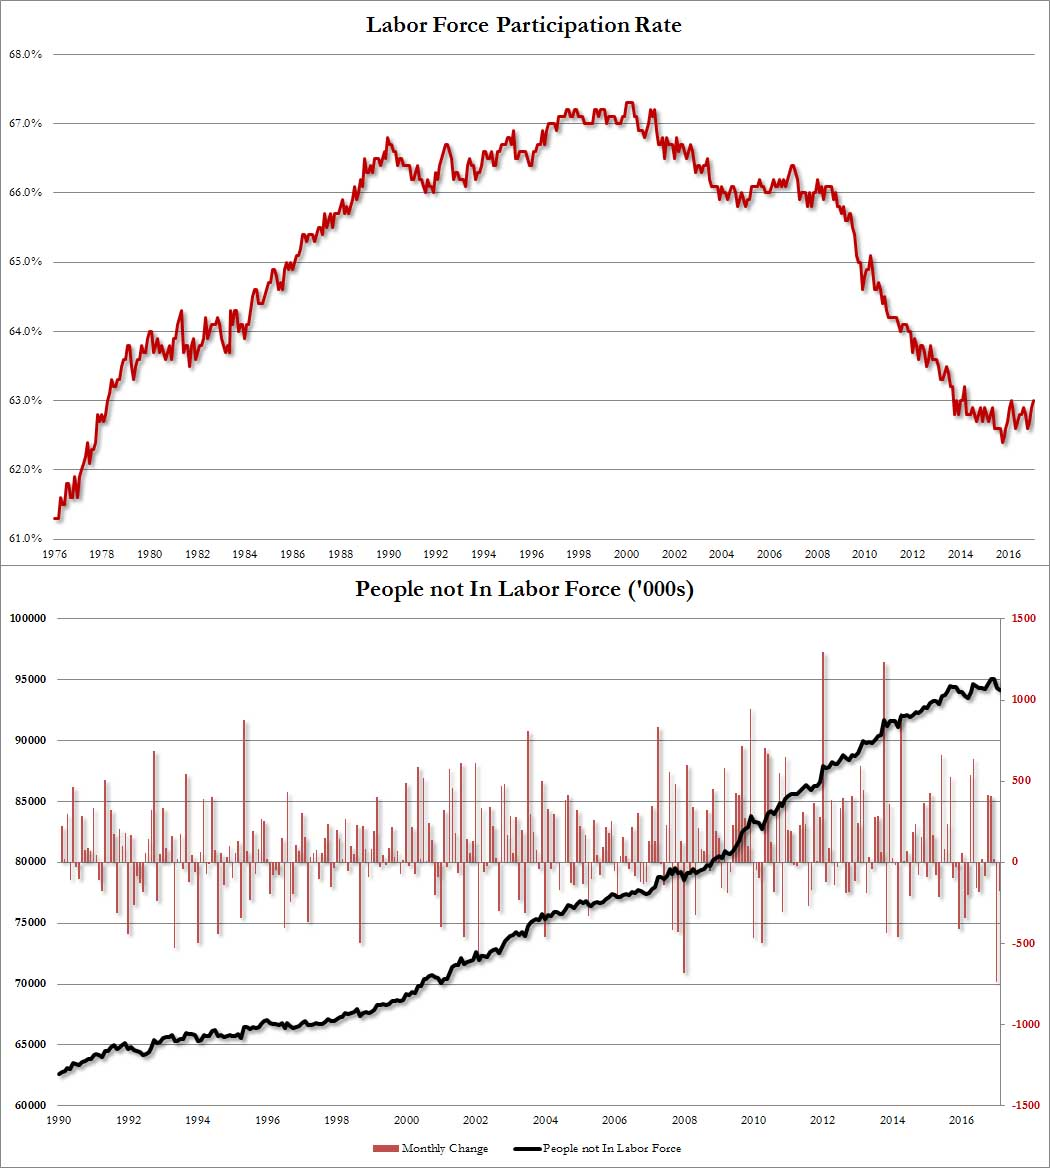
As can been seen from the Chart above, the Overall Workforce Participation Rate has sunk to 63% for workers and there are over 94 million people in the key demographic age group of workers between the ages of 25-54 who are not employed. This situation is highly deflationary for an economy and would have probably caused at least a 20-30% fall in the cost of living except that the Federal Reserve's main goal was to prevent the nominal price level (hence GDP) from falling to match. So instead, thanks to QE, ZIRP, NIRP, and general 'financial repression' we have Financial Asset prices at all-time highs, no safe place to earn a return on investments, and enormous pools of 'fake' Capital looking for a quick buck. To paraphrase Warren Buffet, Capital and Labor went to war and Labor (i.e. the worker) lost.
Treasury Prices Fall and Yields Rise for U.S. 10 Yr. and 30 Yr. Treasuries.
On the Chicago Board of Trade (CBOT): the US 10 Year Treasury Note futures Contract for June settlement closed at a price of 122'26.5 / 32nds; the 10 Year Note was down 10 basis points (bps) on the day, yielding 2.59%. The US 30 Year Treasury Bond futures Contract for June settlement closed at a price of 146'26 / 32nds; the 30 Year Bond was down 30 basis points (bps) on the day, yielding 3.18%. Mortgage Rates were slightly lower on the day from the previous trading session.
Thanks to ZeroHedge.com and Bloomberg Finance L.P. for Charts and Graphics.
ERATE's Daily Rate Summary
March 9, 2017
Treasuries & Mortgage Rates Brace for February Jobs Report Due Out on Friday.
U.S. Treasury prices and Mortgage Rates are rising on expectations that this Friday's BLS Jobs Report will confirm that yesterday's ADP payrolls report, which showed employment in the month of February increased some 298k; was no fluke. On Wednesday, the 10 Yr. U.S. Treasury Note yielded 2.58% and the 30 Yr. U.S. Treasury Bond yielded 3.17%.
U.S. 10 Yr. Treasury Note breaches 2.58% (Chart courtesy of Zerohedge.com).
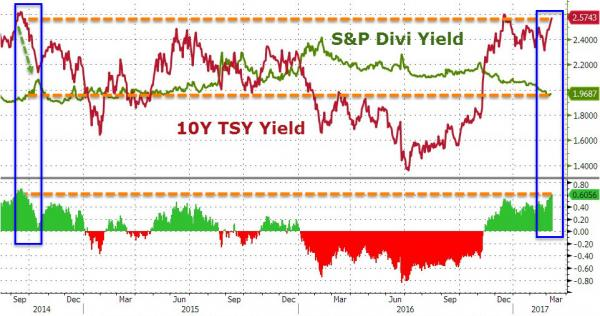
Freddie Mac 30 Year Mortgage Rates hit 4.21% as of March 9th.
Mortgage Rates for 30 Year Fixed rate loans also increased to 4.21% according to Freddie Mac.
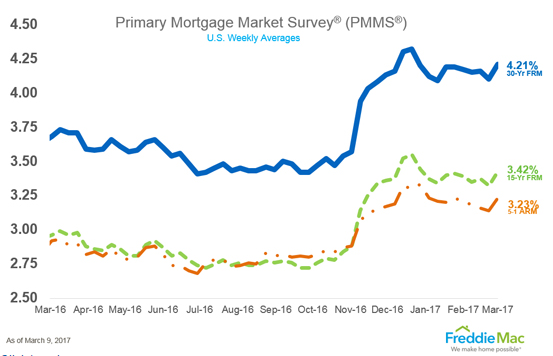
The Chart also shows that the 10 Year Treasury Note yield at 2.5743% (red line) is now far above the S & P Dividend Yield at 1.9687% (green line). This differential in rates is important for a number of reasons, because we've been here before in the recent past (Sept 2014) and it has signaled a transition point (blue boxes) where rates offered a significant buying opportunity for investors looking for yield (returns) on bond investments.
U.S. 10 Yr. Treasury Yield vs. S & P 500 Index since Sept. 2014 'Peak' Yield Spread
(Chart courtesy of Zerohedge.com).
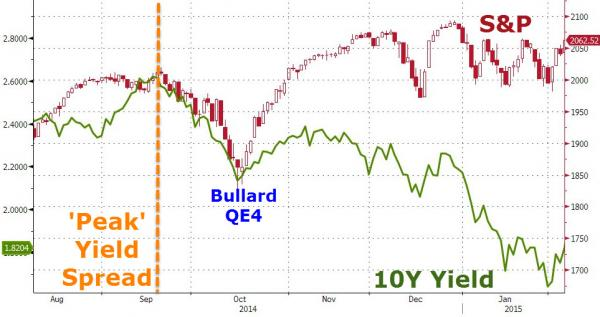
The U.S. 10 Yr. Treasury Yield spread over the S & P Dividend Yield is now almost 61 bps and the last time it was this large was in Sept. 2014 when it was over 70 bps. At that time, it signaled a correction was imminent in the S & P 500 Index and re-allocation of investors capital to bonds was about to take place which culminated in a two-year run in lower Mortgage Rates.
The 30 Yr. Mortgage Rate went from about 4.25% (where it is right now) to the lows in summer of 2016 at around 3.25% which was a 100-bps improvement.

Worst Case: 1994 Bond Market Massacre.
However, an alternate scenario is what happened in 1994 when the Bond Massacre occurred after the February 2014 Fed rate hike of 0.25% (3rd hike) when the 10 Yr. Treasury bond instead rocketed higher by almost 200 bps on fear that the Fed was embarking on a series of rate hikes over the next 12 months.
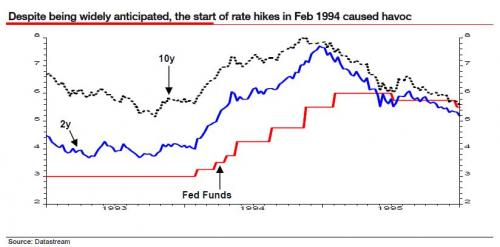
Will it be 3 steps and a stumble or Safe haven re-allocation to Bonds? How this all plays out after the March 15th Fed Meeting and the impact to Mortgage Rates if the Fed decides to raise short term rates by 0.25% is anyone's guess. Fed Funds futures now imply a 100% chance that the Fed hikes next week.
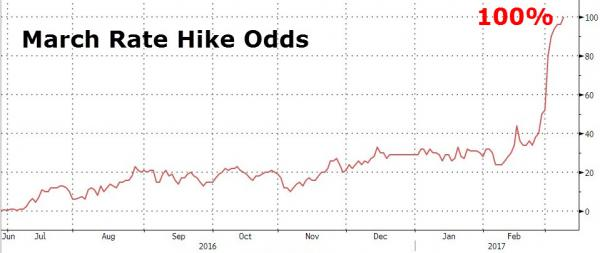
Treasury Prices Fall and Yields Rise for U.S. 10 Yr. and 30 Yr. Treasuries.
On the Chicago Board of Trade (CBOT): the US 10 Year Treasury Note futures Contract for June settlement closed at a price of 123'045 / 32nds; the 10 Year Note was down 10 basis points (bps) on the day, yielding 2.58%. The US 30 Year Treasury Bond futures Contract for June settlement closed at a price of 147'30 / 32nds; the 30 Year Bond was down 30 basis points (bps) on the day, yielding 3.17%. Mortgage Rates were unchanged on the day from the previous trading session.
Thanks to Freddie Mac, ZeroHedge.com, and Datastream, for Charts and Graphics.
ERATE's Daily Rate Summary
March 7, 2017
US Records Biggest Trade Deficit In 5 Years. (from Zerohedge.com)
In a report that will be closely scrutinized by the trade-sensitive Trump administration, today the Department of Commerce announced that the January trade deficit surged in January 2017, jumping from $44.3 billion in December (revised) to $48.5 billion in January, as imports increased more than exports. This was the biggest trade deficit going back to early 2012.
U.S. January Trade Deficit his $48.5 Billion in month
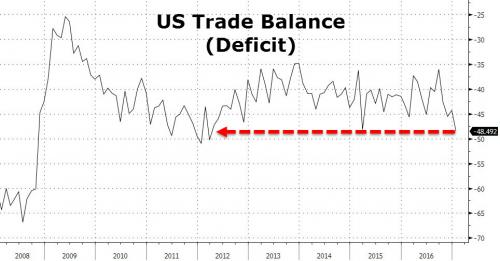
After being stable for few years oscillating around the $40 Billion range, the Trade deficit took a turn for the worse in January. Another US Macro "hard" real data point which is divergent with the string of "soft" survey data such as Consumer Confidence and Business Optimism which are saying that there is economic improvement occurring.
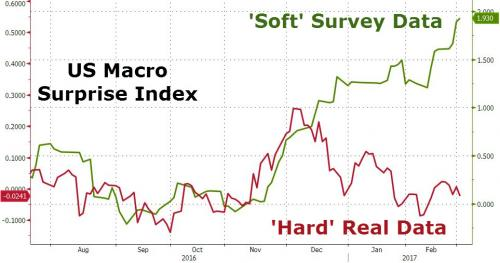
How this effects the narrative being established last week by Federal Reserve speakers, including Fed Chairman Janet Yellen, that an Interest Rate Hike is in the cards for the March 15th Fed Meeting is anyone's guess. As recently as Friday, the odds of a March Rate Hike had soared to over 90%.
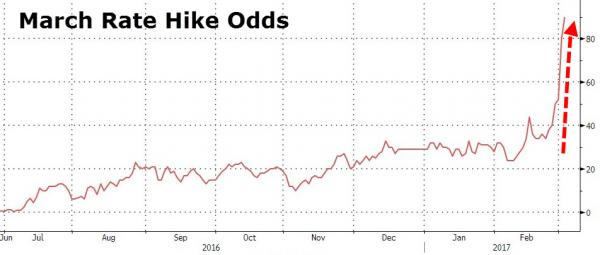
Consequently, Mortgage rates are being pressured by rising Treasury yields (see below) and after having improved up to recently may now be on the rise again. Stay Tuned.
Treasury Yields Rise.
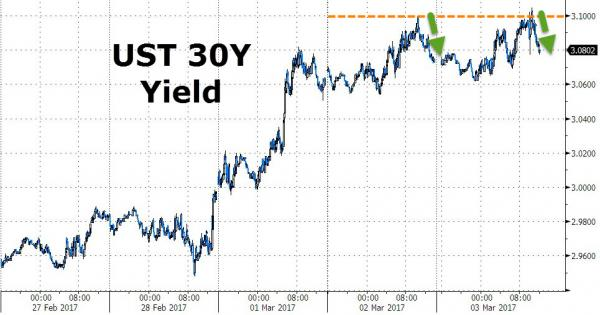
Mortgage Rates Rise?
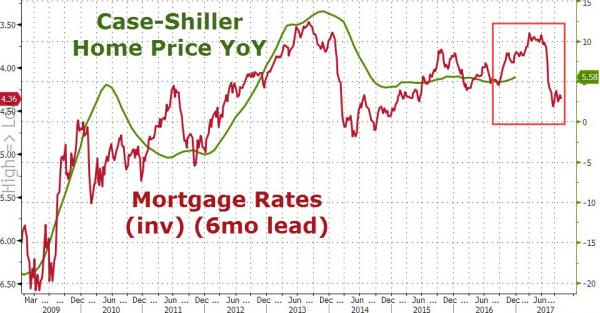
Last week saw a rash of Fed speaker's talk about March Meeting being "In-play". This pressured U.S. 30 Year Treasury yields to move aggressively higher back toward 3.10%. The U.S. 10 Year Treasury Note rose as well with its yield breeching 2.51%. If this persists for a period of time, then Mortgage rates will follow.
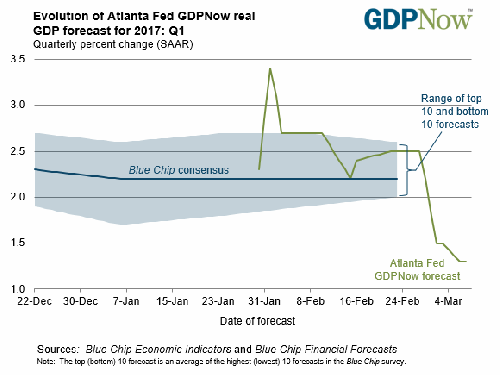
UPDATE: Atlanta Fed GDPNow Forecasts Economic Softness Ahead.
Atlanta Federal Reserve District's GDPNow Model has continued it's downward projection indicating that 1st Quarter U.S. GDP forecast may break below the range of Blue Chip consensus forecasts range of 2.6% - 2.0% growth. The Atlanta Fed's GDPNow model sees Q1 GDP growth of just 1.4% which belies Economic weakness or Stag-flation. How this watched indicator plays into the Fed's March 14-15 Meeting and the decision to raise Interest rates by 0.25% is anybody's guess.
Treasury Prices Fall and Yields Rise for U.S. 10 Yr. and 30 Yr. Treasuries.
On the Chicago Board of Trade (CBOT): the US 10 Year Treasury Note futures Contract for June settlement closed at a price of 123'19 / 32nds; the 10 Year Note was up 0.5 basis points (bps) on the day, yielding 2.48%. The US 30 Year Treasury Bond futures Contract for June settlement closed at a price of 149'02 / 32nds; the 30 Year Bond was down 6 basis points (bps) on the day, yielding 3.09%. Mortgage Rates were unchanged on the day from the previous trading session.
ERATE's Weekly Economic Summary
March 6, 2017
Well, It's Confirmed! A March 15th rate hike by the Fed is coming. Janet Yellen on Friday in Chicago didn't say anything to counterbalance all the Fed speakers this week who said, March is "In Play".
It's wait-and-see for how this will impact Conforming and Jumbo rates for 30 Year Fixed Rate Mortgages which have been in a period of improvement & consolidation since January of 2017. It appears that Mortgage rates have started to follow longer dated Treasury yields higher rising this week to 4.10% for conforming loans and 4.61% for jumbo loans (as of 03-03-2017).

The odds for interest rate increase at the March Federal Open-Market Committee meeting have been relatively stable for the past several weeks, but now are moving up to over 90%.
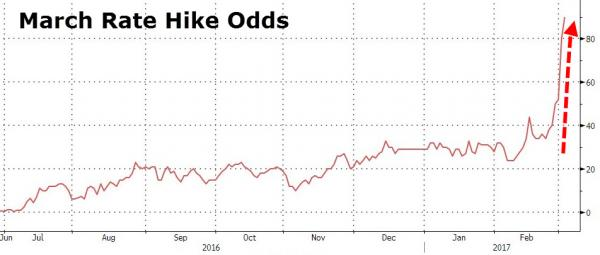
The yield on the 30 Year U.S. Treasury Bond has also noticed this and has begun to rise over this past couple days to over 3.10% for a time.
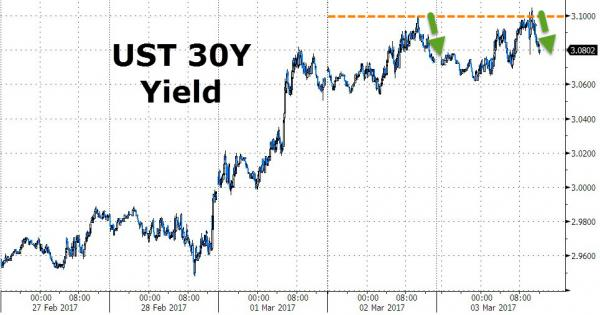
March is Live!
According to Zerohedge.com:Â Wall Street's analysts were delighted to be spoon-fed by Yellen, as the "message received" note by Deutsche Bank demonstrates... ...with virtually everyone now expecting a March rate hike.
Here is a summary of Wall Street's Yellen postmortems.
Deutsche Bank (Joesph LaVorgna)
We expect the Fed to raise rates this month, and then two more times this year. The Fed has become less concerned about inflation, as the growth rate of the core PCE deflator (1.7%) is only a tenth below policymaker's yearend 2017 forecast. We expect a sharp rise in business spending to lift productivity growth from the doldrums, thus raising wage inflation and perhaps labor force participation, too. The Fed will be keen to let these structural changes play out, instead of short-circuiting the business cycle by rapidly raising rates
JPMorgan (Michael Feroli)
Pulls forward expectations for the next rate increase to March from May; increases forecast to 3 hikes -- in March, June and September -- from two previously. "The notably quick pivot in Fed rhetoric continued today and became even blunter"
UBS Wealth Management (Jason Draho)
Yellen comments clarify Fed rate-increase timing, but markets are still assessing pace. "Until there's more evidence of accelerated growth or inflation, we don't think the market's going to price in more in terms of rate hikes". Fed chair's comments have "muted" impact on currencies Friday; UBS sees USD approaching top against EUR and JPY currencies. Expects UST 10Y yield will stay rangebound around 2.50% for next 3, 6 and 12 mo.'s as market digests changes in fiscal policy and Fed tightening cycle.
UniCredit Research (Harm Bandholz)
Fed's eagerness to pull forward next move implies the central bank feels it's getting too far behind the curve. UniCredit moves expectation for next hike to March, from June; now forecasts three increases this year, up from two previously. "Barring any major negative shock over the next couple of days (e.g. a massive selloff in the market or a really disappointing employment report), the Fed will raise in two weeks â€"- and it has to".
CIBC (Bipan Rai)
Yellen remarks send clear signal that Fed will raise rates this month. "With March fully in the price, the lack of new information and the focus on the still neutral medium- term outlook has taken some wind out of the USD's sails". Fed chair's comments suggest three rate increases are acceptable this year.
TD (Mark McCormick)
USD may consolidate as event risk from Yellen speech passes. "We would use a squeeze in positioning near-term to re- engage fresh long USD exposure into next week's data releases with long exposure against CAD, EUR and JPY"
Amherst Pierpont Securities (Stephen Stanley)
Yellen comments give "the final go-ahead that the markets were expecting" for a March rate hike. Economic environment is much healthier now than it was in spring 2016, particularly with higher inflation. Expecting a "triple shot of hike-worthy data points" next week, including strong U.S. payroll data, decline in unemployment rate, and acceleration in y/y average hourly earnings advance.
FTN Financial (Christopher Low)
Yellen said, "they have not yet decided, which implies at least some uncertainty. But, she also drew attention to a particular meeting, which has been used in the past to signal odds of more than 50%. My sense is she believes the FOMC is likely to hike in two weeks, but she has not made up her own mind definitively and will not until she is in the meeting".
Scotiabank (Shaun Osborne)
"Profit-taking is driving USD a bit lower but March looks a lock," and Fed comments may have increased the potential for more than three hikes this year.  <The> Dot plot will increase in importance at March 15 Fed meeting.
Silicon Valley Bank (Minh Trang)
Long-term rate differential will favor the USD even if market is "unimpressed" in short term.
Goldman (Jan Hatzius)
Given constructive comments about current economic conditions from many Fed officials this week we think committee members will see recent news as consistent with their outlook, and therefore supportive of further tightening. We see this as a strong signal for action at the upcoming meeting, and have raised our subjective odds of a hike to 95%.
Weekly Mortgage Rates Analysis
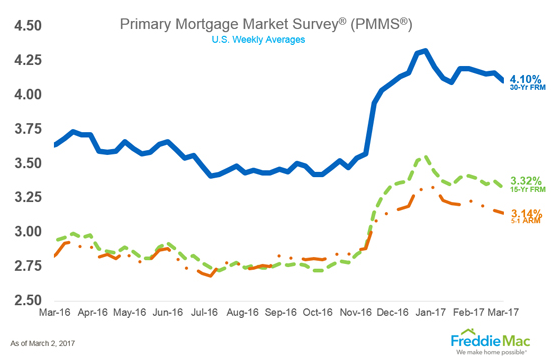
We do not know the future, but this period of super-low interest rates and unprecedented monetary policy moves may be coming to an end and "normalization" of the yield curve may be at hand.
You can take advantage of this period of stability by preparing to be ready for any forthcoming rate improvement by watching real-time rates on Erate's Website using our Rate search tool, understanding your specific Loan Scenario, and calling me for a current tailored rate quote with closing costs. Once the details of your Rate Quote & Loan Closing Costs make sense for you to proceed you will need to complete the On-Line Long Form Application from the link at the top of our home page and I will download it and get back to you over the phone to go over it with you. Your credit score will not be checked at Erate, until you give the go ahead later on. Meanwhile, having started this process now you will be in a position to take advantage quickly of still low historic mortgage interest rates. This would be a good time to get prepared to lock in your Rates!!!
ERATE's Daily Rate Summary
Friday, March 3rd
Fed Chairman Yellen To Speak in Chicago Friday.
Federal Reserve Chairwoman Janet Yellen will deliver a highly-anticipated speech in Chicago on Friday, her last scheduled public remarks before the central bank's March 14-15 policy meeting. Expectations for an increase in short-term interest rates at the gathering have surged this week as other Fed officials have indicated they will consider a move.
Odds of Fed Hike in March Increase to 90%.
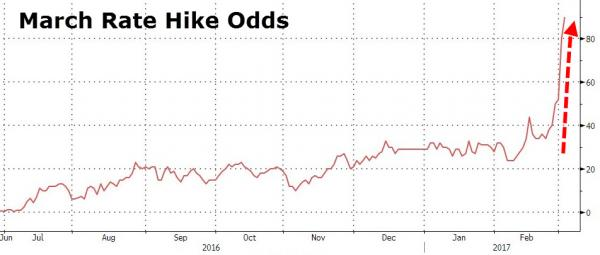
After being stable for few months in the 30% range, the odds of a March 15th Fed Rate Hike soared the week to over 90%. Consequently, Mortgage rates having improved up to recently may now be on the rise again. Stay Tuned.
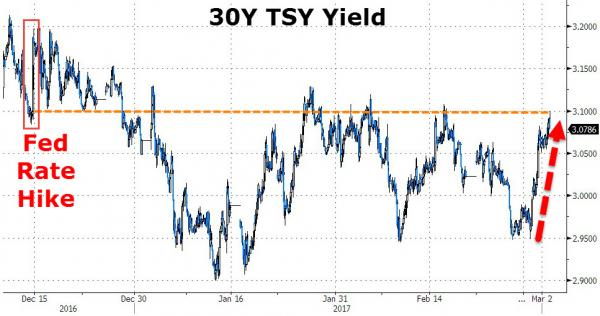
Treasury Yields Rise.
This week saw a rash of Fed speaker's talk about March Meeting being "In-play". This pressured U.S. 30 Year Treasury yields to move aggressively higher back to 3.10%. The U.S. 10 Year Treasury Note rose as well with its yield breeching 2.51%. If this persists for a period Mortgage rates will follow.
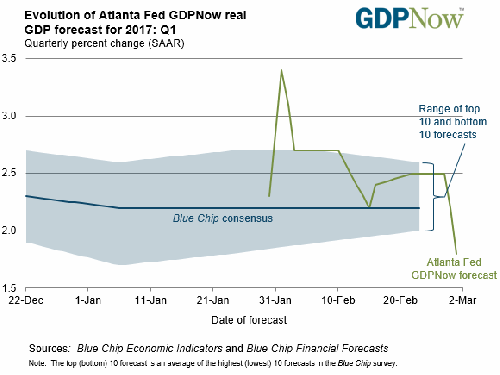
Atlanta Fed GDPNow Forecasts Economic Softness Ahead.
Atlanta Federal Reserve District's GDPNow Model has abruptly turned down over the past week to indicate that 1st Quarter U.S. GDP may soften to below the range of Blue Chip consensus forecasts range of 2.6% - 2.0% growth. The Atlanta Fed's GDPNow model sees Q1 GDP growth of 1.8% which belies Economic weakness or Stag-flation. How this watched indicator plays into the Fed's March 14-15 Meeting and the decision to raise Interest rates by 0.25% is anybody's guess.
Treasury Prices Fall and Yields Rise for U.S. 10 Yr. and 30 Yr. Treasuries.
On the Chicago Board of Trade (CBOT): the US 10 Year Treasury Note futures Contract for June settlement closed at a price of 123'16 / 32nds; the 10 Year Note was down 7 basis points (bps) on the day, yielding 2.49%. The US 30 Year Treasury Bond futures Contract for June settlement closed at a price of 149'03 / 32nds; the 30 Year Bond was down 11 basis points (bps) on the day, yielding 3.08%. Mortgage Rates were little changed on the day from the previous trading session.
ERATE's Weekly Economic Summary
February 27, 2017
Conforming and Jumbo rates for 30 Year Fixed Rate Mortgages have continued their consolidation pattern in the second month of 2017. It appears that rates have started to begin to stabilize rising to 4.15% for conforming loans and 4.46% for jumbo loans.

You can take advantage of this period of stability by preparing to be ready for any forthcoming rate improvement by watching real-time rates on Erate's Website using our Rate search tool, understanding your specific Loan Scenario, and calling me for a current tailored rate quote with closing costs. Once the details of your Rate Quote & Loan Closing Costs make sense for you to proceed you will need to complete the On-Line Long Form Application from the link at the top of our home page and I will download it and get back to you over the phone to go over it with you. Your credit score will not be checked at Erate, until you give the go ahead later on. Meanwhile, having started this process now you will be in a position to take advantage quickly of still low historic mortgage interest rates.
Last Wednesday, the Federal Reserve Board released its minutes from the December Committee meeting and we will see their deliberations about how the individual members voted and the issues impacting the pace of Fed tightening over the coming months. The odds for interest rate increase at the March Federal Open-Market Committee meeting have been relatively stable for the past several weeks, but now are moving up to 50%.
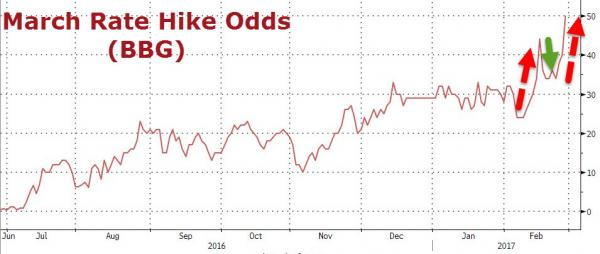
The probability for a March rate hike is expected to rise more as we move closer to the date of the next FOMC meeting on March 15th. Here are the five key areas that The Wall Street Journal thinks are most critical…
A March Signal
Since the meeting, Fed officials have sounded increasingly comfortable about raising rates, perhaps as soon as the next gathering, on March 14-15. Philadelphia Fed President Patrick Harker said a move in March is possible, and Dallas Fed chief Robert Kaplan said rates should rise "sooner rather than later." Chairwoman Janet Yellen said last week the Fed would consider raising rates "at our upcoming meetings," a phrase that left open the possibility of a March move without committing to one. The minutes could offer a better sense about policy makers' readiness to raise rates next month.
Balance Sheet Blues
What to do about the Fed's roughly $4.5 trillion portfolio of assets, or balance sheet, has become one of the year's biggest questions. Some officials have hinted at a willingness to begin shrinking the balance sheet in the near future, but the February meeting statement didn't address the topic. Speaking before Congress last week, Ms. Yellen said she was unwilling to use the balance sheet as a monetary policy tool, a contrast with some ideas floated by some of her colleagues. The minutes could shed light on the internal debate among officials about the future of the Fed's portfolio.
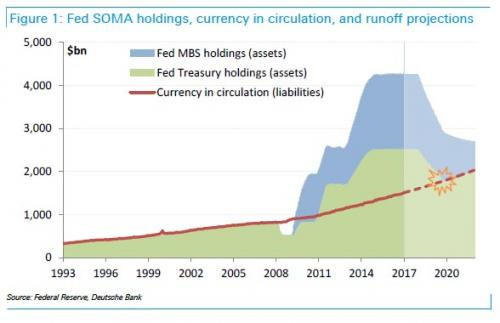
Fiscal Policy
The meeting statement made no mention of the economic and monetary consequences of the Trump administration other than a nod to improving consumer and business sentiment readings. Minutes from the Fed's December meeting indicated officials were split over how to incorporate possible fiscal policy changes into their forecasts. The minutes to be released Wednesday could show whether officials have come to some sort of consensus over how to factor possible tax and spending changes into their monetary policy decision-making.
Is Inflation for Real?
Inflation, measured by the Fed's preferred personal-consumption expenditures price index, has been rising, moving up by 1.6% on the year in December. But it is unclear how much of that increase reflects a short-lived bump from the uptick in oil prices and how much of it is due to underlying strength in the economy. The minutes could help us understand how Fed officials are interpreting recent inflation numbers.
Lurking Dangers
The economy's recent strong patch and talk about the Trump administration's fiscal prioritiesâ€"such as tax cuts and spending boostsâ€"have bred speculation that the economy could perform better than expected this year. But that doesn't mean there aren't threats still abroad. Although the Chinese economy seems more stable than it did this time last year, it still is grappling with a credit boom. And the eurozone could see new waves of volatility as Greece launches another round of debt negotiations. Do Fed officials see any lurking dangers on the international scene? The latest statement didn't say, but the minutes might.
While every nuance will be scoured for insight, we leave readers with the following chart to show just how crucial a decision on the Fed's balance sheet is becoming – as almost $1 trillion matures in the next two years…
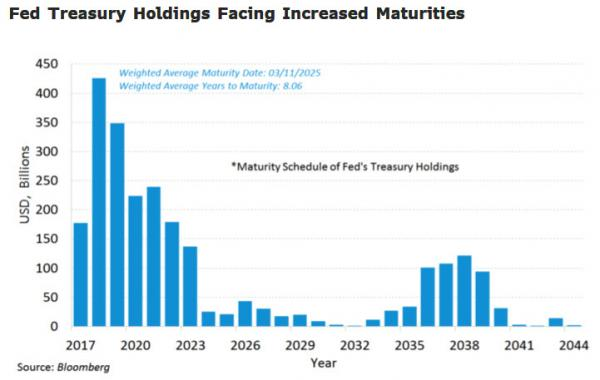
As Bloomberg notes, policy-makers have expressed a preference for passive unwinding over outright asset sales, but details remain sparse. Analysts will look to the minutes for clarity regarding whether officials intend to simply cease reinvestment for all asset classes or whether they will try to modulate the liquidation in a more controlled fashion. Additionally, analysts will attempt to decipher how much interest-rate buffer policy makers want to have in place before initiating the passive liquidation. An important question at this point is: Is this a pivotal moment of Normalization? or Can the QE baton be passed to another CB one last time? Or are the entire world's Central Banks' maxed out with debt as it increasingly appears to be. Mortgage rates are still near historical lows in interest rates and time is of the essence for you to refinance or get your purchase loan.
Weekly Mortgage Rates Analysis
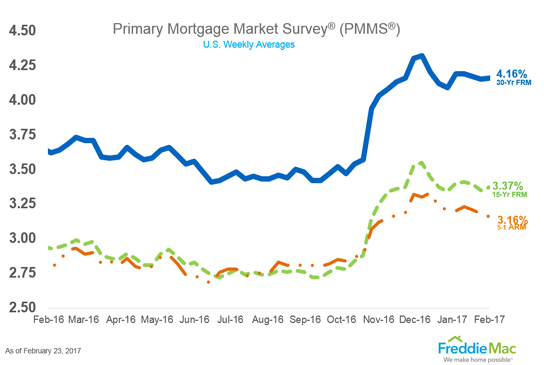
We do not know the future, but this period of super-low interest rates and unprecedented monetary policy moves may be coming to an end and "normalization" of the yield curve may be at hand. This would be a good time to get prepared to lock in your Rates!!!
ERATE's Weekly Economic Summary
February 22, 2017
Conforming and Jumbo rates for 30 Year Fixed Rate Mortgages have continued their consolidation pattern in the first month of 2017. It appears that rates have started to begin to improve falling to 4.15% for conforming loans and 4.26% for jumbo loans.

You can take advantage of this period of stability by preparing to be ready for any forthcoming rate improvement by watching real-time rates on Erate's Website using our Rate search tool, understanding your specific Loan Scenario, and calling me for a current tailored rate quote with closing costs. Once the details of your Rate Quote & Loan Closing Costs make sense for you to proceed you will need to complete the On-Line Long Form Application from the link at the top of our home page and I will download it and get back to you over the phone to go over it with you. Your credit score will not be checked at Erate, until you give the go ahead later on. Meanwhile, having started this process now you will be in a position to take advantage quickly of still low historic mortgage interest rates.
On Wednesday, the Federal Reserve Board will release its minutes from the December Committee meeting and we will see their deliberations about how the individual members voted and the issues impacting the pace of Fed tightening over the coming months. The odds for interest rate increase at the March Federal Open-Market Committee meeting have been relatively stable for the past several weeks at 36%.
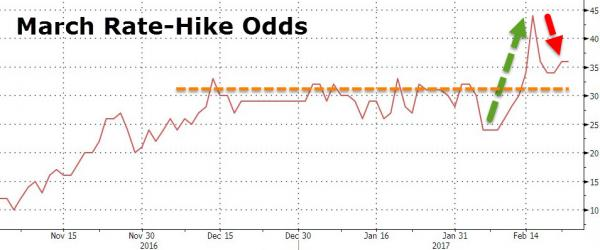
The probability for a March rate hike is expected to rise to 50% or more as we move closer to the date of the next FOMC meeting. Here are the five key areas that The Wall Street Journal thinks are most critical...
A March Signal
Since the meeting, Fed officials have sounded increasingly comfortable about raising rates, perhaps as soon as the next gathering, on March 14-15. Philadelphia Fed President Patrick Harker said a move in March is possible, and Dallas Fed chief Robert Kaplan said rates should rise "sooner rather than later." Chairwoman Janet Yellen said last week the Fed would consider raising rates "at our upcoming meetings," a phrase that left open the possibility of a March move without committing to one. The minutes could offer a better sense about policy makers' readiness to raise rates next month.
Balance Sheet Blues
What to do about the Fed's roughly $4.5 trillion portfolio of assets, or balance sheet, has become one of the year's biggest questions. Some officials have hinted at a willingness to begin shrinking the balance sheet in the near future, but the February meeting statement didn't address the topic. Speaking before Congress last week, Ms. Yellen said she was unwilling to use the balance sheet as a monetary policy tool, a contrast with some ideas floated by some of her colleagues. The minutes could shed light on the internal debate among officials about the future of the Fed's portfolio.
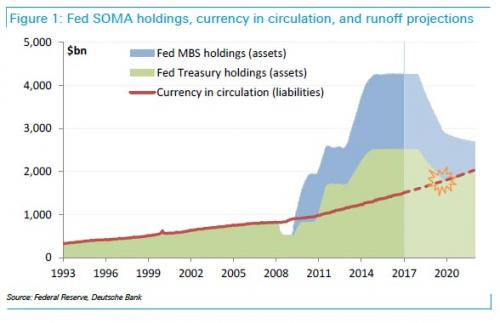
Fiscal Policy
The meeting statement made no mention of the economic and monetary consequences of the Trump administration other than a nod to improving consumer and business sentiment readings. Minutes from the Fed's December meeting indicated officials were split over how to incorporate possible fiscal policy changes into their forecasts. The minutes to be released Wednesday could show whether officials have come to some sort of consensus over how to factor possible tax and spending changes into their monetary policy decision-making.
Is Inflation for Real?
Inflation, measured by the Fed's preferred personal-consumption expenditures price index, has been rising, moving up by 1.6% on the year in December. But it is unclear how much of that increase reflects a short-lived bump from the uptick in oil prices and how much of it is due to underlying strength in the economy. The minutes could help us understand how Fed officials are interpreting recent inflation numbers.
Lurking Dangers
The economy's recent strong patch and talk about the Trump administration's fiscal prioritiesâ€"such as tax cuts and spending boostsâ€"have bred speculation that the economy could perform better than expected this year. But that doesn't mean there aren't threats still abroad. Although the Chinese economy seems more stable than it did this time last year, it still is grappling with a credit boom. And the eurozone could see new waves of volatility as Greece launches another round of debt negotiations. Do Fed officials see any lurking dangers on the international scene? The latest statement didn't say, but the minutes might.
While every nuance will be scoured for insight, we leave readers with the following chart to show just how crucial a decision on the Fed's balance sheet is becoming – as almost $1 trillion matures in the next two years...
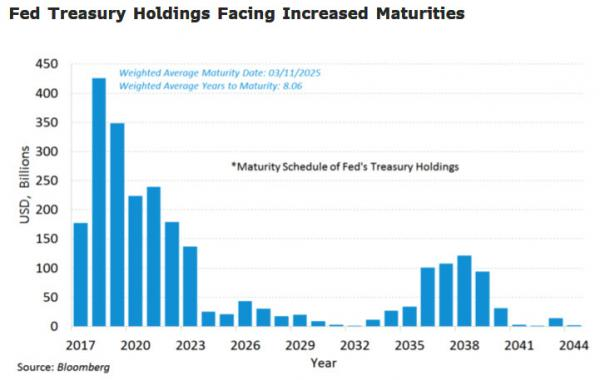
As Bloomberg notes, policy-makers have expressed a preference for passive unwinding over outright asset sales, but details remain sparse. Analysts will look to the minutes for clarity regarding whether officials intend to simply cease reinvestment for all asset classes or whether they will try to modulate the liquidation in a more controlled fashion. Additionally, analysts will attempt to decipher how much interest-rate buffer policy makers want to have in place before initiating the passive liquidation. An important question at this point is: Is this a pivotal moment of Normalization? or Can the QE baton be passed to another CB one last time? Or are the entire world's Central Banks' maxed out with debt as it increasingly appears to be. Mortgage rates are still near historical lows in interest rates and time is of the essence for you to refinance or get your purchase loan.
Weekly Mortgage Rates Analysis
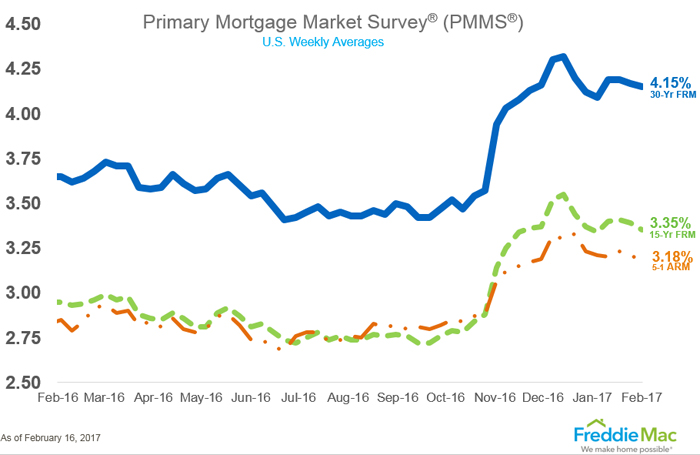
We do not know the future, but this period of super-low interest rates and unprecedented monetary policy moves may be coming to an end and "normalization" of the yield curve may be at hand. This would be a good time to get prepared to lock in your Rates!!!
ERATE's Weekly Economic Summary
February 13, 2017
Conforming and Jumbo rates for 30 Year Fixed Rate Mortgages have continued their consolidation pattern in the first month of 2017. It appears that rates have started to begin to improve falling to 4.17% for conforming loans and 4.20% for jumbo loans.

You can take advantage of this period of stability by preparing to be ready for any forthcoming rate improvement by watching real-time rates on Erate's Website using our Rate search tool, understanding your specific Loan Scenario, and calling me for a current tailored rate quote with closing costs. Once the details of your Rate Quote & Loan Closing Costs make sense for you to proceed you will need to complete the On-Line Long Form Application from the link at the top of our home page and I will download it and get back to you over the phone to go over it with you. Your credit score will not be checked at Erate, until you give the go ahead later on. Meanwhile, having started this process now you will be in a position to take advantage quickly of still low historic mortgage interest rates.
On Tuesday, the Federal Reserve Chairman Janet Yellen is set to deliver her semi-annual Humphry Hawkins testimony to Congress when she goes in front of Senate Finance Committee. The odds for interest rate increase at the March Federal Open-Market Committee meeting have been relatively stable for the past several weeks at 30%.
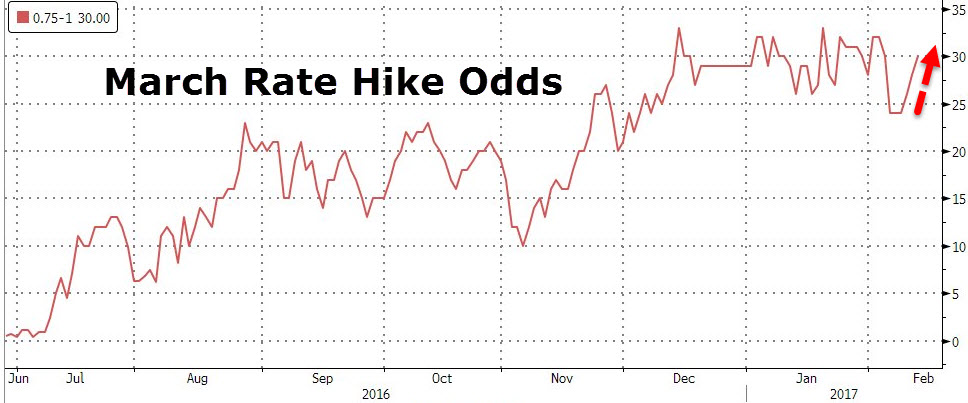
She will then speak before the House Financial Services Committee on Wednesday. Even though we're unlikely to hear much new from Yellen, many banks believe she will use it as an opportunity to emphasize that the economy is reaching Congress' legislated mandates of full employment and price stability. Some banks, most notably BofA, expect her to boost March rate hike odds closer to 50% to make the meeting "live."
Yellen will also likely address Fed balance sheet strategy in broad terms as it does not appear that the FOMC has formed a consensus around the details.
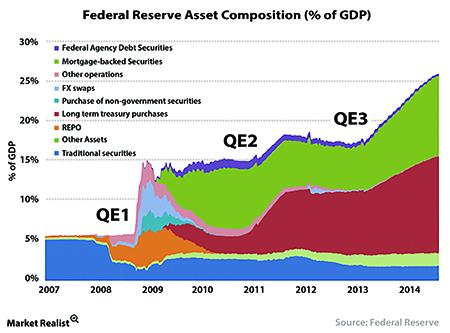
The Federal Reserve Balance Sheet has stopped increasing and the question that is yet unresolved is when and how to begin selling off positions and to whom.
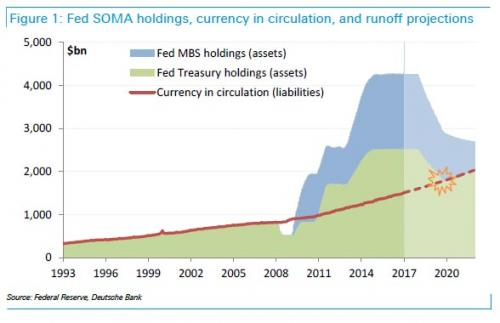
As any observer can see that we've got to this point after seven years of coordinated Central Bank bond buying may be reaching its limits worldwide.
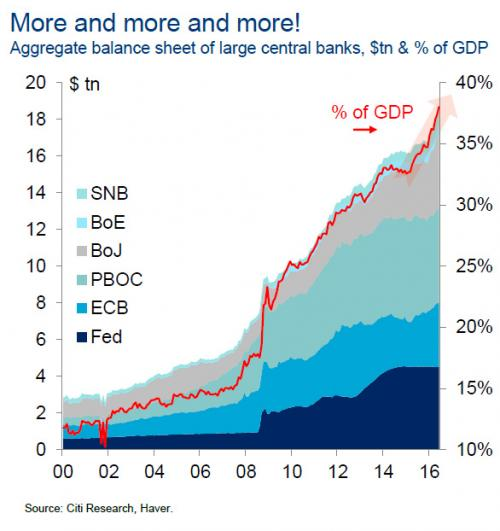
An important question at this point is: Is this a pivotal moment of Normalization? or Can the QE baton be passed to another CB one last time? Or are the entire world's Central Banks' maxed out with debt as it increasingly appears to be. For Mortgage Rates we are still near historical lows in interest rates and time is of the essence for you to refinance or get your purchase loan.
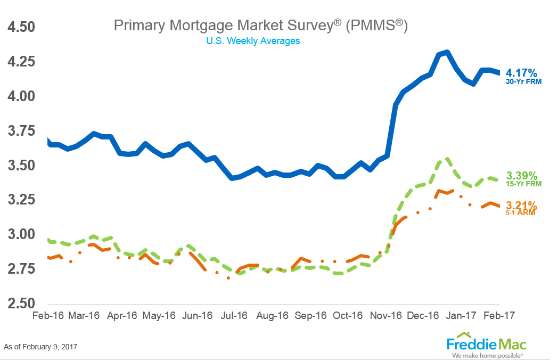
Weekly Mortgage Rates Analysis
We do not know the future, but this period of super-low interest rates and unprecedented monetary policy moves may be coming to an end and "normalization" of the yield curve may be at hand. This would be a good time to get prepared to lock in your Rates!!!
ERATE's Weekly Economic Summary
February 02, 2017
Conforming and Jumbo rates for 30 Year Fixed Rate Mortgages have continued their consolidation pattern in the first month of 2017. It appears that rates have started to begin to improve falling to 4.19% for conforming loans and 4.42% for jumbo loans.

You can take advantage of this period of stability by preparing to be ready for any forthcoming rate improvement by watching real-time rates on Erate's Website using our Rate search tool, understanding your specific Loan Scenario, and calling me for a current tailored rate quote with closing costs. Once the details of your Rate Quote & Loan Closing Costs make sense for you to proceed you will need to complete the On-Line Long Form Application from the link at the top of our home page and I will download it and get back to you over the phone to go over it with you. Your credit score will not be checked at Erate, until you give the go ahead later on. Meanwhile, having started this process now you will be in a position to take advantage quickly of still low historic mortgage interest rates.
From a historical perspective, Mortgage Applications are low having fallen dramatically since the election in November as Treasury Bond yields backed up by +100 bps over that time.
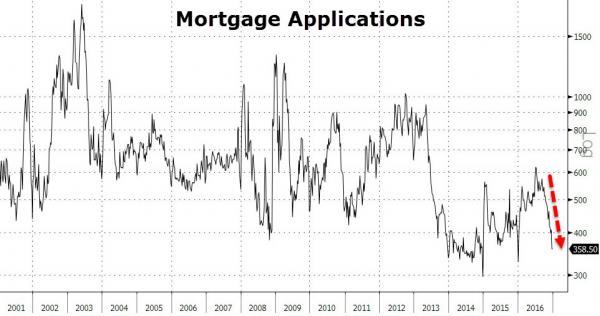
This is combination is slowing a key engine of economic activity: home purchases due to rise in 30YR Mortgage Rates.
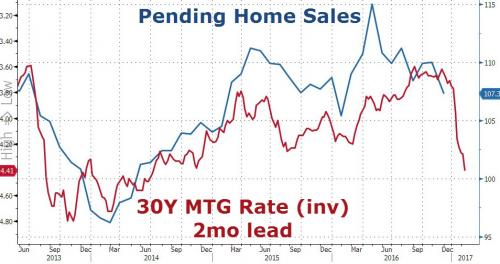
Affordability is now becoming stretched by home prices and financing costs.
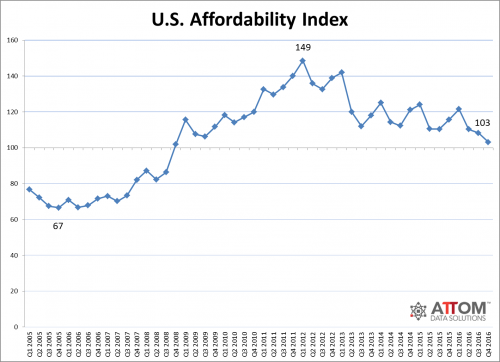
Mortgage applications seem to have found a bottom and if Mortgage rates continue to decline over the coming weeks activity will improve. If this happens, be prepared, and move fast.
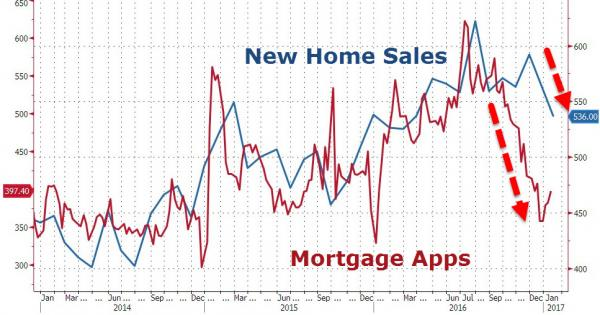
We are still near historical lows in interest rates and time is of the essence.
Weekly Mortgage Rates Analysis
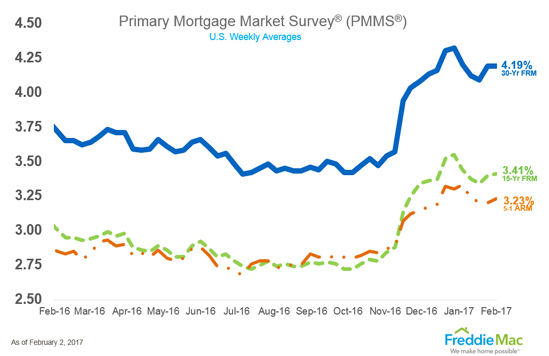
We do not know the future, but this period of super-low interest rates and unprecedented monetary policy moves may be coming to an end and "normalization" of the yield curve may be at hand. This would be a good time to get prepared to lock in your Rates!!!
ERATE's Weekly Economic Summary
January 16, 2017
After rising dramatically for the past six weeks to over 4.30% for 30 Year Fixed Rate Mortgages, it appears that rates have started to begin to improve falling to 4.12% for conforming loans and 4.40% for jumbo loans.

You can take advantage of this period of stability by preparing to be ready for any forthcoming rate improvement by watching real-time rates on Erate’s Website using our Rate search tool, understanding your specific Loan Scenario, and calling me for a current tailored rate quote with closing costs. Once the details of your Rate Quote & Loan Closing Costs make sense for you to proceed you will need to complete the On-Line Long Form Application from the link at the top of our home page and I will download it and get back to you over the phone to go over it with you. Your credit score will not be checked at Erate, until you give the go ahead later on. Meanwhile, having started this process now you will be in a position to take advantage quickly of still low historic mortgage interest rates.
Calendar of Upcoming Economic data this week:
Here is a full breakdown of just US events, together with consensus estimates, courtesy of Goldman Sachs
The key economic release this week is CPI on Wednesday. There are several scheduled speaking engagements from Fed officials this week, including two by Chair Yellen on Wednesday and Thursday. The Beige Book for the January FOMC period will be released on Wednesday.
Monday, January 16
- US markets are closed in observance of Martin Luther King, Jr. Day. There will be no economic data releases.
Tuesday, January 17
- 08:45 AM New York Fed President Dudley (FOMC voter) speaks: Federal Reserve Bank of New York President William Dudley will give a speech on “Evolving Consumer Behavior: A View from the Federal Reserve Bank of New York” at an event sponsored by the National Retail Federation.
- 08:30 AM Empire manufacturing survey, January (consensus +8.5, last +9.0)
- 10:00 AM Fed Governor Brainard (FOMC voter) speaks: Federal Reserve Governor Lael Brainard will give a speech on “The Impact of Fiscal Policy on Monetary Policy” at the Brookings Institution in Washington D.C. Audience Q&A is expected.
- 06:00 PM San Francisco Fed President Williams (FOMC non-voter) speaks: Federal Reserve Bank of San Francisco President John Williams will give the keynote speech at the Sacramento Business Review Economic Forecast at Sacramento State University in California. Audience and media Q&A is expected.
Wednesday, January 18
- 08:30 AM CPI (mom), December (GS +0.29%, consensus +0.30%, last +0.20%); Core CPI (mom), December (GS +0.20%, consensus +0.20%, last +0.15%); CPI (yoy), December (GS +2.1%, consensus +2.1%, last +1.7%); Core CPI (yoy), December (GS +2.2%, consensus +2.2%, last +2.1%): We expect that core CPI rose by 0.20% in December or 2.2% on a year-over-year basis. In the November report, core inflation was softer than expected, mainly due to lower inflation in the categories of apparel, medical care, airfares, and lodging away from home. We expect some payback in the apparel category, in part related to colder-than-average December temperatures. Headline consumer prices likely increased by 0.29% in December. On a year-over-year basis, the headline index likely increased by 2.1%.
- 09:00 AM Dallas Fed President Kaplan (FOMC voter) speaks: Federal Reserve Bank of Dallas President Robert Kaplan will participate in a panel discussion on “Confidence in Uncertain Times”. Media and audience Q&A is expected. President Kaplan is a voting member of the FOMC this year.
- 09:15 AM Industrial production, December (GS +1.1%, consensus +0.6%, last -0.4%): Manufacturing production, December (GS +0.4%, consensus +0.5%, last -0.1%); Capacity utilization, December (GS 75.8%, consensus 75.4%, last 75.0%): We expect industrial production to rebound by 1.1% in the December report following two months of weakness, based on our expectation of a rebound in the weather-sensitive utilities category.
- 10:00 AM NAHB housing market index, January (consensus 69, last 70): Consensus expects the NAHB homebuilders' indexâ€"which we have found to be a decent leading indicator of housing startsâ€"to tick down to 69, though still near post-crisis highs.
- 11:00 AM Minneapolis Fed President Kashkari (FOMC voter) speaks: Federal Reserve Bank of Minneapolis President Neel Kashkari will give a speech on economic opportunity and inclusive growth at an event hosted by the Minneapolis Urban League. Audience and media Q&A is expected. President Kashkari will be a voting member on the FOMC this year.
- 02:00 PM Beige Book, January-February FOMC meeting period: The Fed's Beige Book is a summary of regional economic anecdotes from the 12 Federal Reserve districts. The December Beige Book reported modestly slower activity in a few districts, stronger consumer spending and residential investment, and mixed manufacturing activity. In the January-February Beige Book, we will look for additional anecdotes related to the state of manufacturing activity, price inflation, and wage growth.
- 03:00 PM Fed Chair Yellen (FOMC voter) speaks: Federal Reserve Chair Janet Yellen will give a speech on “The Goals of Monetary Policy and How We Pursue Them” in front of the Commonwealth Club of California in San Francisco. Audience Q&A is expected.
- 04:00 PM Total Net TIC Flows (last +$18.8bn)
Thursday, January 19
- 08:30 AM Housing starts, December (GS +12.0%, consensus +8.6%, last -18.7%); Building permits, December (consensus +1.1%, last -3.8%): We expect housing starts to rebound 12% in December, following a 19% drop in November led by the volatile multifamily category. Despite colder-than-usual December temperatures, favorable single-family fundamentals and a rising backlog of approved permits suggest scope for a meaningful rebound. Consensus expects a more modest rise of 8.6% for housing starts and looks for a 1.1% increase in building permits.
- 08:30 AM Initial jobless claims, week ended January 14 (GS 265k, consensus 251k, last 247k); Continuing jobless claims, week ended January 7 (last 2,087k): We expect initial jobless claims to rebound 18k to 265k, following two consecutive readings not far from the cycle low. We remain in a period where seasonal adjustment is difficult, and we are hesitant to infer a drop in the trend pace of layoffs based on the most recent two reports. Seasonality-related uncertainty will affect the data for at least two more weeks, and accordingly, confidence around our 265k forecast is low. The drop in initial claims has not yet been mirrored in continuing claims, which have actually risen relative to the levels in early December (as of the week ending December 31).
- 08:30 AM Philadelphia Fed manufacturing index, January (GS +16.0, consensus +16.0, last +19.7): We expect the Philadelphia Fed manufacturing survey to pull back to +16.0 following last month's increase to +19.7, remaining at levels signaling expansion in manufacturing activity. Last week, the Federal Reserve Bank of Philadelphia conducted its annual historical revision and calculation of new seasonal adjustment factors. For December, the index was revised down modestly to +19.7 from +21.5.
- 10:00 AM San Francisco Fed President Williams (FOMC non-voter) speaks: Federal Reserve Bank of San Francisco President John Williams will give the keynote address at the Solano Economic Development Corporation's Annual Luncheon Meeting in Fairfield, California. Audience Q&A is expected.
- 08:00 PM Fed Chair Yellen (FOMC voter) speaks: Federal Reserve Chair Janet Yellen will give a speech on the economic outlook and US monetary policy at an event hosted by the Stanford Institute for Economic Policy Research. Audience Q&A is expected.
Friday, January 20
- 09:00 AM Philadelphia Fed President Harker (FOMC voter) speaks: Federal Reserve Bank of Philadelphia President Patrick Harker will participate in a discussion on the economic outlook at the New Jersey Bankers Association's 6th Annual NJ Economic Leadership Forum. Media Q&A is expected. Last week, President Harker reiterated his support for three rate hikes this year.
- 01:00 PM San Francisco Fed President Williams (FOMC non-voter) speaks: San Francisco Fed President John Williams will give closing remarks at the Bay Area Council Economic Institute’s 10th Annual Economic Forecast event in San Francisco. Audience Q&A is expected. Remarks will likely be similar to those from his speaking engagement on Tuesday.
Source: BofA, DB, Goldman
This is a hopeful sign, because the stability we are seeing now may signal that Mortgage Rates may improve somewhat over the coming weeks. If this happens, be prepared, and move fast.
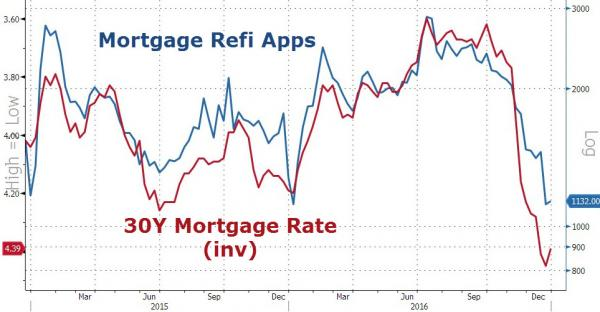
We are still near historical lows in interest rates and time is of the essence.
Weekly Mortgage Rates Analysis
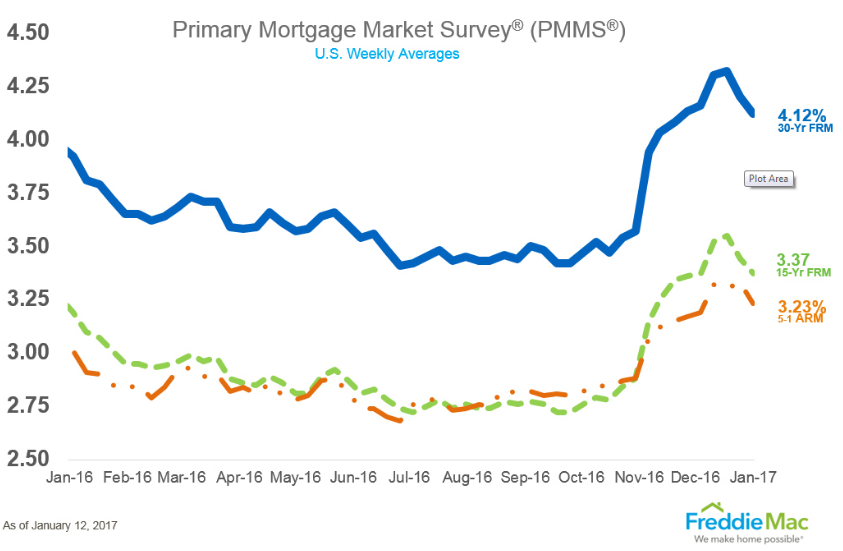
We do not know the future, but this period of super-low interest rates and unprecedented monetary policy moves may be coming to an end and "normalization" of the yield curve may be at hand. This would be a good time to get prepared to lock in your Rates!!!
ERATE's Weekly Economic Summary
January 10, 2017
Richmond Fed's "Hawkish" President Jeffery Lacker To Retire.
Just three months after Atlanta Fed president Dennis Lockhart announced he would step down as president, on Tuesday another FOMC member, the "hawkish" president of the Richmond Fed, Jeffery Lacker, 61, also decided to call it quits as well, and on Tuesday said he will retire as president and chief executive officer of the Federal Reserve Bank of Richmond on Oct. 1, after 28 years at the Federal Reserve Bank.
Wholesale Sales Disappoint Sending Inventories-Ratio Back into Recession Territory.
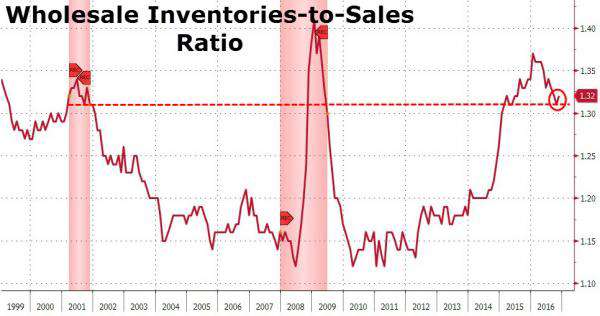
November saw inventories rise more than expected (+1.0% MoM vs +0.9% exp) and sales disappoint (+0.4% vs +0.5% exp) and were notably revised lower. This sent the inventories-to-sales ratio back up again – stubbornly stuck in recessionary territory. Automotive inventories-to-sales jumped higher once again – back to near cycle highs.
Trumphoria Sends Small Business Optimism Soaring Most since 1980.
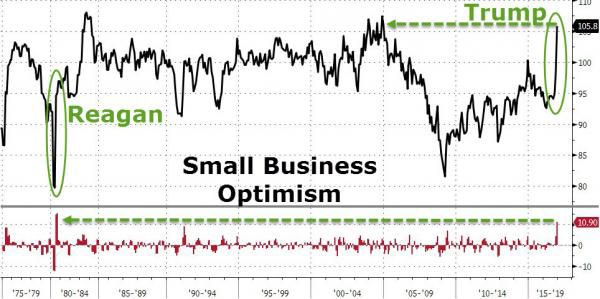
Since Donald Trump won the US election, small business optimism has exploded higher (from 94.9 in Oct to 105.8 in Dec). At the most optimistic since 2004, the last 2 months have seen the biggest spike in hope since 1980's Reagan era spike. With 50% expecting a better economy - the third highest number in history - we do however note that expectations for earnings remain negative.
Consumer Credit Soars, Driven By Near Record Credit Card-Fueled Spending.
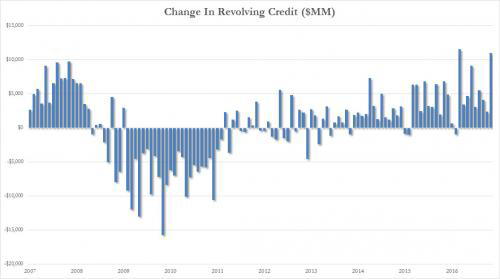
After several months of tepid growth in the revolving consumer credit, i.e., credit cards, the latest monthly report from the Fed revealed that Americans went on a credit card-funded shopping spree in November, when total revolving credit exploded higher by a massive $11 billion, the highest November increase on record, and the second highest of the post-crash period.
Treasury Prices Mostly Unchanged and Yields Steady at 2.38%.
On the Chicago Board of Trade (CBOT): the US 10 Year Treasury Note futures Contract for March settlement closed at a price of 124'24.5 / 32nds; the 10 Year Note was down 0.5 basis points (bps) on the day, yielding 2.38%. The US 30 Year Treasury Bond futures Contract for March settlement closed at a price of 152'20 / 32nds; the 30 Year Bond was down 6 basis points (bps) on the day, yielding 2.97%. Mortgage Rates were little changed on the day from the previous trading session.
ERATE's Daily Rate Summary
September 25, 2015
A speech by Fed Chair Yellen at Amherst College yesterday seemed to go a long way in easing the concerns of the financial markets that indeed the Fed was not holding back information of a weak economic picture and that the intention was in fact to raise rates by the end of 2015 as previously stated.
Q2 Gross Domestic Product (final revision) rose at an annualized rate of 3.9%, up from the second revision of 3.7% where it was expected to remain. Personal Consumption was revised up to 3.6% when the forecast called for a gain of 3.2%. The GDP Price Index (or GDP Deflator) was unchanged at 2.1%, matching the forecast. The Core PCE Index (ex food and energy) was revised higher to 1.9% when the forecast called for no change from 1.8%.
The University of Michigan Consumer Sentiment Index for September fell to 87.2, marking the lowest reading in a year, when the forecast called for a reading of 87.1. The initial reading was 85.7 and the reading for August was 91.9.
The Markit U.S. Services PMI Index fell in September to 55.6 from Augusts' reading of 56.1. Note that a reading above 50 reflects an economic expansion.
Next Week: On Monday look for Personal Income and Spending, Pending Home Sales and Core Inflation. On Tuesday watch for the Case-Shiller Home Price Index and Consumer Confidence. On Wednesday look for Chicago PMI, MBA Mortgage Applications and the ADP Employment Report. On Thursday watch for Weekly Jobless Claims, Market PMI, ISM Manufacturing Index and Construction Spending. On Friday look for the September Jobs Report and Unemployment Rate as well as Factory Orders.
Treasury Yields closed higher today with the yield on the mortgage rate-driven 10 year note up 4 basis points (bps), yielding 2.16% and the 30 year bond up 4 basis points (bps), yielding 2.96%.
ERATE's Daily Rate Summary
September 23, 2015
Treasuries were relatively flat today with economic data in the U.S. revealing strong manufacturing output in conjunction with a surge in mortgage applications. Uncertainty over Fed policy remains at the forefront of investor's minds as the Fed continues to deliver mixed messages. The Dallas Fed's reading on inflation has garnered some attention as its trimmed mean measurement far exceeds that of the PCE deflator which the FOMC has tended to closely follow. Global growth concerns were amplified by a disappointing reading on manufacturing activity from China. European Central Bank (ECB) President Draghi spoke today and the message conveyed was that an expansion of the current asset purchase program (or QE) was not a sure thing.
Markit Flash U.S. Manufacturing PMI Index for September came in at 53.0 while the forecast called for a reading of 52.8. The reading for August was also 53.0. Note that a reading above 50 reflects an economic expansion.
The MBA Mortgage Application Index rose 13.9% for the week ending on September 19th after falling 7.0% in the prior week. The Refinance Index rose 17.7% while the Purchase Index rose 9.1%. The average rate on a 30-year mortgage was unchanged at 4.09%.
This Week: On Thursday watch for Fed Chair Yellen's Speech, Durable Goods Orders, Weekly Jobless Claims, New Home Sales, the Chicago Fed National Activity Index and the Kansas City Fed Manufacturing Index. On Friday watch for Gross Domestic Product (GDP), Consumer Sentiment and Markit Flash PMI Services.
Treasury Yields closed higher today with the yield on the mortgage rate-driven 10 year note up 2 basis points (bps), yielding 2.15% and the 30 year bond up 1 basis point (bp), yielding 2.95%.
ERATE's Daily Rate Summary
September 22, 2015
Volatility in the equity market translated into a safe haven rally in the U.S. Treasury market today. Global growth concerns coupled with the on-going uncertainly surrounding the Fed rate hike put pressure on equity prices. Healthcare and auto stocks took a particular beating following comments from the Clinton campaign targeting drug prices by the pharmaceutical industry as well as the recent and potentially industry-wide developments emerging out of Volkswagen. There remain four Fed District Presidents who continue to see a Fed rate hike occurring in 2015.
The Richmond Fed Manufacturing Index dropped to a negative or minus 5 reading in September. This represents the first negative reading since April. The forecast called for a reading of positive 2 while the reading for August was left unchanged at zero. Note that a reading below zero reflects an economic contraction.
The Federal Housing Finance Agency's (FHFA) Housing Price Index rose 0.6% in July when the forecast called for an increase of 0.4%. This represents the biggest monthly gain since February. The index rose 0.2% in June. The FHFA Index consists of single family housing data provided by the government sponsored enterprises Fannie Mae and Freddie Mac. Look for the release of the housing's Case Shiller Index next week.
This Week: On Wednesday watch for the Markit Flash PMI Manufacturing Index and MBA Mortgage Applications. On Thursday watch for Fed Chair Yellen's Speech, Durable Goods Orders, Weekly Jobless Claims, New Home Sales, the Chicago Fed National Activity Index and the Kansas City Fed Manufacturing Index. On Friday watch for Gross Domestic Product (GDP), Consumer Sentiment and Markit Flash PMI Services.
Treasury Yields closed lower today with the yield on the mortgage rate-driven 10 year note down 7 basis points (bps), yielding 2.13% and the 30 year bond down 8 basis points (bps), yielding 2.94%.
ERATE's Daily Rate Summary
September 11, 2015
U.S. Treasury yields were lower today on news that would have normally sent yields higher. The Producer Price Index came in above the target range, contributing to the Fed's argument to increase rates. The Fed begins its two day meeting on rates next week on September 16-17.
The Producer Price Index (PPI) was flat in August when the forecast called for a decline of 0.2%. The reading for July showed an increase of 0.2% and was not revised. Core PPI (ex food & energy) rose 0.3% in August when the forecast called for an increase of only 0.1%. The reading for July showed an increase of 0.3% and was not revised.
The University of Michigan Consumer Sentiment Index dropped to 85.7 in September when the forecast called for a reading of 90.3. This marked the lowest reading since September of 2014. The reading for August came in at 91.9. It is believed that the turmoil in the equities market is the primary factor contributing to the shift in sentiment.
The Treasury Budget Deficit through August came in at $64.4BB, higher than the forecast of $62.0BB but down significantly from $129BB, the reading from August of 2014. The deficit overall is $530BB through August, roughly 10% below the reading from a year ago due to an increase in both individual and corporate tax receipts. Revenue overall grew 8% as almost 2.7 million new jobs were added in the fiscal year.
Next Week: On Monday, no major economic indicators are scheduled for release. On Tuesday watch for Retail Sales, Industrial Production, Capacity Utilization, Business Inventories and the Empire State Index. On Wednesday, the FOMC meeting begins, look for the Consumer Price Index (CPI), the Housing Market Index and MBA Mortgage Applications. On Thursday, the FOMC meeting concludes, watch for the FOMC Announcement, Housing Starts, Weekly Jobless Claims, Building Permits, the Philly Fed and Current Account. On Friday look for Leading Indicators.
Treasury Yields closed lower today with the yield on the mortgage rate-driven 10 year note down 4 basis points (bps), yielding 2.19% and the 30 year bond down 4 basis points (bps), yielding 2.95%.
ERATE's Daily Rate Summary
September 10, 2015
A rise in stocks today may have put the brakes on Treasury prices as yields went higher. Uncertainty ahead of next week's FOMC meeting and the Fed's decision on rates may also be weighing on Treasury prices. Today's report on jobless claims met expectations while wholesale inventories and import prices both missed their forecasts.
Weekly Jobless Claims fell to 275,000 in the week ending September 5th, a drop of 6,000 claims. This reading matched the forecast. The reading for the previous week was revised downward to 281,000, a reduction of 1,000 claims. The four week moving average rose to 275,750, an increase of only 500 claims.
Wholesale Inventories fell 0.1% in July when the forecast called for a gain of 0.3%. This represented the first decline in inventories in two years. The reading for June was revised lower from an increase of 0.9% to a rise of 0.7%.
Import Price Index fell 1.8% in August when the forecast called for a drop of 1.6%. This represented the largest drop since the beginning of the year. The sharp drop in oil prices along with the strengthening dollar are the primary contributing factors. The reading for July of 0.9% remained unchanged.
This Week: On Friday watch for the Producer Price Index (PPI), Consumer Sentiment and the Federal Budget.
Treasury Yields closed higher today with the yield on the mortgage rate-driven 10 year note up 3 basis points (bps), yielding 2.22% and the 30 year bond up 3 basis points (bps), yielding 2.98%.
ERATE's Daily Rate Summary
September 09, 2015
Chief Economist Basu at the World Bank joined IMF Chief Lagarde, as well as former U.S. Treasury Secretary Summers, in urging the Fed against hiking rates at the September 16-17 meeting. It was suggested that a rate increase at this time could result in panic in the emerging markets and that it would be better if the Fed waited until the global economy sees more stability. Both China and Japan announced new fiscal stimulus measures leading to a rally in both equities markets.
The Jolts Report is the Labor Department's Job Openings and Labor Turnover Survey. The survey reflects openings as positions that are open and remain unfilled. For the month of July, openings increased to 5.75MM when the forecast called for openings of 5.3MM openings. The reading for June was revised higher from 5.2MM to 5.3MM. The number of unemployed job seekers relative to job openings fell to the lowest level since 2000, yet hiring fell from 5.18MM in June to 4.98MM in July. The Quits Rate, a measure of worker confidence, remained the same for the fourth month, at 1.9%.
Redbook, a weekly indicator of comparable same chain store sales growth rose 1.3% in the week ending September 5th. The report indicates strength going into the Labor Day Holiday due in part to back-to-school purchases as well as seasonal apparel demand.
The MBA Mortgage Application Index fell 6.2% for the week ending September 5th. In the prior week, ending September 29th, the index rose 11.3%. The Refinance Index fell 9.9% while the Purchase Index fell 0.9%. The average rate on a 30 year mortgage rose to 4.10%, climbing 2 basis points (bps) from the prior week.
The Quarterly Services Survey, a measure of revenue from information and technology related industries, rose 1.3% in Q2 over Q1. Year over year growth in revenue climbed 3.8%.
This Week: On Thursday look for Weekly Jobless Claims, Import and Export Prices and Wholesale Trade and on Friday watch for the Producer Price Index (PPI), Consumer Sentiment and the Federal Budget.
Treasury Yields closed flat today with the yield on the mortgage rate-driven 10 year note unchanged, yielding 2.19% and the 30 year bond yielding 2.95%.
ERATE's Daily Rate Summary
September 08, 2015
Equities continued to rise today, shifting buyers away from the security of the Treasury market. The stock market in China rose almost 3% in spite of weak trade data, this sparked speculation that it was in fact Chinese state-backed funds which were responsible for doing the buying. Data released today out of the eurozone came in stronger than expected contributing to a mild rally in most European markets. San Francisco Fed Chief Williams, considered by Fed watchers to be a centrist, revealed in a WSJ interview that he is still undecided as to whether he will vote to raise rates at this month's Fed meeting.
The National Federation of Independent Business (NFIB) Small Business Optimism Index rose 0.5 points to 95.9 in August when the forecast called for an increase to 96.0. The reading for July was 95.4. The employment component of the index surged to the highest level since 2005.
The Conference Board's Employment Trends Index rose to 128.82 in August up from 127.64 in July. The index reflects the health of the labor market and is based on eight indicators. This 4.5% increase over last year's reading reveals an economy that is primed to produce solid job gains over the next four months.
Consumer Credit rose in July by $19.1BB which was higher than the forecast which called for an increase to $18.6BB. The reading for June was revised higher from $20.7BB to $27.0BB.
This Week: On Wednesday watch for Job Openings (JOLTS), Redbook, MBA Mortgage Applications and the Quarterly Services Survey. On Thursday look for Weekly Jobless Claims, Import and Export Prices and Wholesale Trade and on Friday watch for the Producer Price Index (PPI), Consumer Sentiment and the Federal Budget.
Treasury Yields closed higher today with the yield on the mortgage rate-driven 10 year note up 6 basis points (bps) yielding 2.19% and the 30 year bond up 6 basis points (bps) yielding 2.95%.
ERATE's Daily Rate Summary
September 03, 2015
Today brought positive reports on both service sector activity and the trade deficit. Chinese markets were closed for the celebration of the end of World War II giving global markets a breather. The European Central Bank (ECB) left is benchmark rate unchanged as expected and hinted at an extension of QE if needed. All eyes will be on tomorrow's August Jobs numbers, the last report prior to the Fed meeting on September 16th and 17th; it is expected to show that 213,000 jobs were added.
Institute for Supply Management (ISM) non-Manufacturing Index fell to 59.0 in August when the forecast called for a reading of 58.0. The reading for July was 60.3. Note that a reading above 50 reflects an economic expansion.
Weekly Jobless Claims rose to 282,000 for the week of August 23nd through the 29th, this was an increase of 12,000 claims for the period. The forecast called for 275,000 new claims. The previous week saw a revision downward from 271,000 to 270,000 claims. The four-week moving average rose to 275,500, an increase of 3,250 claims. Note that new claims have remained under the 300,000 threshold for the past six month, marking the longest stretch since 2000.
The U.S. Trade Deficit fell 7.4% to $41.9BB in July when the forecast called for a deficit of $41.8BB. The reading for June was revised upward from $43.8BB to $45.2BB. The drop in the trade deficit could be a positive sign for GDP in the third quarter as GDP growth typically comes in stronger when the deficit is shrinking.
Markit Services PMI (final revision) rose to 56.1 in August and was revised higher from the initial reading of 55.2. The reading for July was 55.7. Note that a reading above 50 reflects an economic expansion.
This Week: On Friday look for the August Jobs Report, where 213,000 jobs are expected to have been added, as well as the Unemployment Rate and Average Hourly Earnings.
Treasury Yields closed lower today with the yield on the mortgage rate-driven 10 year note down 3 basis points (bps) yielding 2.16% and the 30 year bond down 2 basis points (bps) yielding 2.93%.
ERATE's Daily Rate Summary
September 02, 2015
U.S. Economic data released today was largely positive as second quarter productivity gains beat estimates while the Fed's Beige Book Report hinted at growing wage pressure within some Federal Reserve Districts. All Fed watchers are anxiously awaiting the release of Friday's Jobs Report for August where 213,000 jobs are expected to have been added. Bond guru Bill Gross criticized the Fed today saying that the opportunity to raise rates had already past and that earlier in the year provided the window that was missed to raise rates without serious fallout from the financial markets.
U.S. Productivity (Q2 final revision) rose at a 3.3% annual rate in the second quarter, the forecast called for an increase of 3.2%, up from the initial reading of 1.3%. This marked the fastest pace of productivity growth since 2013. A sizable jump in productivity was expected following the large upward revision in Q2 GDP from 2.3% to 3.7% last week. However productivity has risen only 0.7% in the past year and is viewed by analysts as having been extremely weak over the course of the six year recovery. Productivity appears to have slowed globally and has remained an inexplicable subject of concern to economists as it is essential to a rising standard of living. Unit Labor Costs fell 1.4%, matching the forecast, after reportedly rising 0.5%. Hourly wages rose 1.8%, unrevised from the prior estimate, while inflation adjusted wages fell 1.1%.
Factory Orders increased 0.4% in July, the second month of gains, though the forecast called for an increase of 1.0%. The reading for June was revised upward from 1.8% to 2.2%.
The ADP Employment Change Report showed that private sector jobs rose by 190,000 in August. The forecast called for an increase of just over 200,000. The reading for July was revised downward from 185,000 to 177,000. Analysts use ADP's report to get a temperature reading on the upcoming jobs report scheduled for release by the Labor Department on Friday. The forecast calls for 213,000 nonfarm jobs to have been added in the month of August.
The Beige Book reflects economic conditions in the 12 Federal Reserve Districts and is used by the Fed in making policy decisions. The report reflected modest to moderate growth for the period between July and mid-August across most regions. Wages were stable and reflected a mild to moderate increase since the time of the last report. However it was noted that several Districts reported seeing rising wage pressure resulting from a tightening labor market.
The MBA Mortgage Application Index rose 11.3% for the week ending August 29th after rising 0.2% the prior week. The Refinance Index jumped 16.8% while the Purchase Index rose 4.1%. The average rate on a 30-year mortgage was unchanged from last week and remains at 4.08%.
This Week: On Thursday watch for Weekly Jobless Claims, the Trade Deficit and ISM Non-Manufacturing. On Friday look for the August Jobs Report, including the Unemployment Rate as well as Average Hourly Earnings.
Treasury Yields closed higher today with the yield on the mortgage rate-driven 10 year note up 3 basis points (bps) yielding 2.19% and the 30 year bond up 4 basis points (bps) yielding 2.95%.
ERATE's Daily Rate Summary
September 01, 2015
The ISM Manufacturing Index slowed to its weakest level in two years just as manufacturing data out of China fell to a three year low. Today's news on manufacturing reveals growing weakness from the world's top two economic powerhouses, the U.S. and China. Canada also appears to have fallen into a technical recession, experiencing two consecutive quarters of negative economic growth, representing more bad news for the U.S. as Canada is its biggest trading partner. All more food for thought as the Fed weighs the timing of its first rate hike since 2006.
The Institute for Supply Management (ISM) Manufacturing Index fell in August to 51.1 when the forecast called for a reading of 52.2. This marked the slowest pace of growth in the sector since May of 2013. The strong dollar has made U.S. exports more costly while global growth is slowing down. The reading for July was 52.7. Note that a reading above 50 reflects an economic expansion.
Construction Spending rose 0.7% in July matching the forecast. The reading for June was revised upward from 0.1% to 0.7%. Construction appears to be the strongest sector of the economy, now comprising 5% of GDP and rising 13.7% in the prior year. It is possible this strong reading could produce an upward revision to Q2 GDP.
The Markit U.S. Manufacturing PMI Index (final revision) rose from 52.9 to 53.0 in August while the forecast called for the reading to remain unchanged. The reading for July was 53.8. Note that a reading above 50 reflects an economic expansion.
This Week: On Wednesday look for Productivity, Factory Orders, Beige Book, Unit Labor Costs and ADP Employment. On Thursday watch for Weekly Jobless Claims, the Trade Deficit and ISM Non-Manufacturing. On Friday look for the August Jobs Report, including the Unemployment Rate as well as Average Hourly Earnings.
Treasury Yields closed lower today with the yield on the mortgage rate-driven 10 year note down 5 basis points (bps) yielding 2.16% and the 30 year bond down 4 basis points (bps) yielding 2.92%.
ERATE's Daily Rate Summary
August 31, 2015
Hawkish comments from Fed Vice-Chair Fischer out of Jackson Hole over the weekend weighed heavily on the markets. Fischer reflected that current disinflationary pressure stemming from the drop in oil prices, as well as the stronger dollar, would prove to be transitory and likely to fade soon. Therefore Fischer went on to say that the Fed should not wait for inflation to reach its target before beginning to raise rates. Fed Funds Futures are currently discounting the probability of a September rate increase at 38%. On-going market volatility in China weighed heavily on global sentiment and the debate continued surrounding the impact that China's sale of $1.5TT of U.S. government debt in support of the yuan will have on Treasury yields. On Thursday the European Central Bank (ECB) is scheduled to meet and there is some speculation they may extend the current asset purchase program (QE) beyond September 2016 in response to global deflationary pressure and the stronger euro.
The Chicago Purchasing Managers Index fell to 54.4 in August when the forecast called for a reading of 54.7 which would have matched the reading for July (at 54.7). Note that a reading above 50 reflects economic expansion.
The Dallas Fed Manufacturing Index dropped unexpectedly to negative 15.8 in August when the forecast called for an increase to negative 4.0 from July's reading of negative 4.6. The Dallas Federal Reserve is reporting a sharp deterioration of conditions in Texas as a result of the decline in oil prices. Note that a reading below zero reflects an economic contraction.
This Week: On Tuesday watch for Markit PMI, ISM and Construction Spending. On Wednesday look for Productivity, Factory Orders, Beige Book, Unit Labor Costs and ADP Employment. On Thursday watch for Weekly Jobless Claims, the Trade Deficit and ISM Non-Manufacturing. On Friday look for the August Jobs Report, including the Unemployment Rate as well as Average Hourly Earnings.
Treasury Yields closed higher today with the yield on the mortgage rate-driven 10 year note up 3 basis points (bps) yielding 2.21% and the 30 year bond up 4 basis points (bps) yielding 2.95%.
ERATE's Daily Rate Summary
Nancy Osborne, June 24, 2015
U.S. Treasury yields reversed course following a two day rise as what appeared to be real progress towards a Greek finance resolution began to unravel. Safe-haven buyers of Treasuries brought yields back down modestly today. This marked the second day of this week's Treasury Dept. auction of $90BB in new securities and it was met with very disappointing demand. Today's $35BB five-year note auction saw the weakest demand in three months. It was a light news day with little on the economic calendar scheduled for release.
Q1 Gross Domestic Product (GDP) was revised upward to negative 0.2% from negative 0.7%. This revision was in line with forecasts. The GDP Price Index (or GDP Deflator) was revised upward to a flat reading at 0.0% from a negative reading of 0.1%. The Core PCE Index (ex food and energy) remained unrevised at 0.8% matching forecasts.
The MBA Mortgage Application Index increased 1.6% for the week ending on June 20th after declining 5.5% the previous week. The Refinance Index rose 1.8% and the Purchase Index rose 1.2% for the week.
This Week: On Thursday watch for Consumer Spending and Personal Income as well as Weekly Jobless Claims and Core Inflation. On Friday Consumer Sentiment is scheduled for release.
Treasury Yields closed lower today with the yield on the mortgage rate-driven 10 year note down 4 basis points (bps) yielding 2.37% and the 30 year bond down 5 basis points (bps) yielding 3.15%.
ERATE's Daily Rate Summary
Nancy Osborne, June 23, 2015
Treasury yields rose for the second day as demand for safe-haven sovereign debt fell on optimism that a Greek finance deal will be reached. Remarks by Fed Governor Powell, a voting FOMC member, indicated the Fed was looking for a rate increase by September and hoped to follow with another in December, as U.S. economic conditions strengthen in the second half of the year. Some technical pressure was also felt in the Treasury market as $26BB in two-year notes were sold today in the first leg of the government's $90BB auction this week.
New Home Sales rose 2.2% in May to 546,000 units when the forecast called for 525,000 units. This was the best reading since February 2008. The increase in sales came mostly from the Northeast region. The inventory level of new homes fell to a 4.5 month supply, a balanced market calls for a 6 month's supply. The reading for April was revised upward from 517,000 to 534,000.
Durable Goods Orders were down 1.8% for May when the forecast called for a decline of 1.5%. The reading for April was revised downward from a drop of 1.0% to a drop 1.5%. The decline was attributed to a decline in aircraft orders. Excluding transportation, Durable Goods Orders rose 0.5% in May when the forecast called for an increase of 0.6%. April's ex-transport reading was revised lower from a drop of 0.2% to a drop of 0.3%.
Markit U.S. Manufacturing PMI Index fell to 53.4 in June from a 54.0 reading in May. The forecast called for reading of 54.1. A reading above 50 reflects an expansion.
The Richmond Fed Manufacturing Activity Index rose to 6 in June from a reading of 1 in May when the forecast called for an increase to 4. A reading above zero reflects an expansion.
This Week: On Wednesday look for another revision to first quarter GDP and on Thursday watch for Consumer Spending and Personal Income as well as Weekly Jobless Claims and Core Inflation. On Friday Consumer Sentiment is scheduled for release.
Treasury Yields closed higher today with the yield on the mortgage rate-driven 10 year note up 4 basis points (bps) yielding 2.41% and the 30 year bond also up 4 basis points (bps) yielding 3.21%.
ERATE's Daily Rate Summary
June 22, 2015
U.S. Treasuries and German Bunds both moved higher as safe-haven purchases of bonds evaporated with the news of an eleventh hour Greek finance resolution becoming more likely. Nineteen euro zone finance ministers met in Brussels on Monday to hash out a deal between Greece and its creditors, reportedly with serious progress being made towards compromise. Pressure on Treasury prices also came from a solid reading on U.S. Existing Home Sales for May, which the Fed will no doubt take into account in the timing of their first rate move, as well as added technical pressure coming from a $90BB supply of new Treasury notes coming up for auction this week.
Existing Home Sales rose 5.1% in May to 5.35MM units when the forecast called for an increase of 5.25MM units. This was the greatest number of homes sold in a month since November of 2009. The gain was due largely to first time buyers who accounted for 32% of all sales in May. April's sales were revised upward to 5.09MM units from 5.04MM units. The median home price rose 7.9% year-over-year to $228,700. Inventories in May rose 3.2% bringing the supply of available inventory down to 5.1 months.
The Chicago Fed National Activity Index, comprises a weighted average of 85 economic indicators, rose to negative 0.17 from negative 0.19. A reading of zero reflects a growth rate that is running at the U.S. trend line and a negative 0.70 reading indicates a recession is in progress.
This Week: On Monday look for Existing Home Sales and the Chicago Fed Index. On Tuesday watch for Durable Goods Orders and New Homes Sales. On Wednesday look for another revision to first quarter GDP and on Thursday watch for Consumer Spending and Personal Income as well as Weekly Jobless Claims and Core Inflation. On Friday Consumer Sentiment is scheduled for release.
Treasury Yields closed broadly higher today with the yield on the mortgage rate-driven 10 year note up 13 basis points (bps) yielding 2.39% and the 30 year bond also up 13 basis points (bps) yielding 3.18%.
ERATE's Daily Rate Summary
Nancy Osborne, June 11, 2015
U.S. Treasury yields saw their sharpest one day decline in over two weeks after falling off of seven month highs. Yields in the U.S. continued to move in tandem with yields in the euro zone as sovereign bonds saw strengthening demand. The final leg of the Treasury's $58BB auction of fixed-rate securities concluded today with the 30-year bond. Also in the mix this week was nearly $30BB in investment grade corporate debt issuances. Retail Sales numbers for May were released today and met expectations for the first time in months, reflecting the greatest monthly rise in several years. Also released today were Initial Jobless Claims and Business Inventories, as well as Import/Export Prices, which were all greater than expected. It is noteworthy that Treasuries with long-dated maturities saw such high demand on a day when the economic data coming in was so strong.
Retail Sales met expectations rising 1.2% in May. A revision for April showed an improvement from an initially flat reading to a gain of 0.2%. With the exception of health and personal care, all retail sectors showed strength with a spending increase in 12 of 14 categories.
Business Inventories for April were up 0.4%, the forecast called for a rise of 0.2%. March's reading remained unrevised up 0.1%.
Weekly Initial Jobless Claims for the week ending June 6th increased to 279,000, rising 2,000 from the previous week. The forecast called for claims of 275,000. Claims for the prior week were revised higher by 1,000 to 277,000. The four-week moving average rose to 278,750, climbing 3,750.
The Import Price Index rose in May by 1.3% versus the projected gain of 0.8%. April's reading was revised upward from a decrease of 0.3% to a drop of only 0.2%
U.S. Treasury Auction Concluded Today: This week the U.S. Treasury sold $58BB in 3-year, 10-year and 30-year securities which was met with solid demand. On Tuesday, $24BB in 3-year notes was auctioned, followed by $21BB in 10-year notes on Wednesday and $13BB in 30-year bonds on Thursday.
This Week: On Friday watch for the Producer Price Index and Consumer Sentiment.
Treasury Yields closed lower today with the yield on the mortgage rate-driven 10 year note down 10 basis points (bps) yielding 2.39% and the 30 year bond down 12 basis points (bps) yielding 3.10%.
ERATE's Daily Rate Summary
Nancy Osborne, June 10, 2015
Today was a very light day on the economic calendar.
U.S. Treasuries continue to move in step with German Bunds. As deflation fears in the euro zone have eased, yields in Germany have soared above 1% for the first time in nine months, sending bond markets around the globe into a tail spin. Add in the blow out U.S. jobs numbers released on Friday, combined with the $58BB government securities auction held this week, along with a hefty supply of corporate bond issuances becoming available and the stage is set for higher yields for U.S. Treasuries.
The MBA Mortgage Application Index increased 8.4% in the past week after falling 7.6% the prior week. The Refinance Index rose 7.0% and the Purchase Index climbed 9.7%. These sizable increases all occurred in a rapidly rising interest rate environment.
U.S. Treasury Auction: This week the U.S. Treasury is scheduled to sell $58BB in 3-year, 10-year and 30-year securities. On Tuesday, $24BB in 3-year notes was auctioned, followed by $21BB in 10-year notes on Wednesday and $13BB in 30-year bonds on Thursday.
This Week: On Thursday look for Retail Sales and Business Inventories and on Friday watch for the Producer Price Index and Consumer Sentiment.
Treasury Yields closed higher today with the yield on the mortgage rate-driven 10 year note up 4 basis points (bps) yielding 2.49% and the 30 year bond also up 4 basis points (bps) yielding 3.22%.
ERATE's Daily Rate Summary
Nancy Osborne, June 9, 2015
Yields on both 10-year and 30-year U.S. Treasuries hit their highest levels in seven months before easing back down slightly. Since April, Treasury yields have risen sharply, almost in lock step with German Bunds, as economic data coming from the euro zone has been better than forecast, pushing yields sharply higher. Friday's release of the surprisingly good May Jobs Report has worked to drive Treasury yields even higher as the possibility of a Fed rate hike in September becomes more likely. Supply pressures are also impacting Treasuries this week as a $58BB three-day U.S. government auction gets underway and as much as $30BB in investment grade corporate bonds are sold.
Wholesale Inventories for April rose 0.4% vs. the forecast for a 0.2% increase. Wholesale Inventories for March were revised upwards to 0.2% from 0.1%. Wholesale Sales rose 1.6% in April after falling 0.3% in March.
Job Openings and Labor Turnover Survey (JOLTS) was released by the Labor Dept. and is considered a report closely watched by Fed Chair Yellen. The survey is a measure of the demand for labor that has not been met. In April, 5.38MM jobs were open and waiting to be filled. This was more than the 5.04MM jobs forecast and was also higher than March's reading of 5.11MM job openings.
The National Federation of Independent Business Small Business Optimism Index for May rose to 98.3, higher than the forecast of 97.2. April's reading remained unchanged at 96.9.
U.S. Treasury Auction: This week the U.S. Treasury is scheduled to sell $58BB in 3-year, 10-year and 30-year securities. On Tuesday, $24BB in 3-year notes will be auctioned, followed by $21BB in 10-year notes on Wednesday and $13BB in 30-year bonds on Thursday.
This Week: On Thursday look for Retail Sales and Business Inventories and on Friday watch for the Producer Price Index and Consumer Sentiment.
Treasury Yields closed higher today with the yield on the mortgage rate-driven 10 year note up 6 basis points (bps) yielding 2.44% and the 30 year bond also up 6 basis points (bps) yielding 3.17%.
ERATE's Daily Rate Summary
June 8, 2015
No major economic indicators are scheduled for release today.
Last week the bond market witnessed its worst week in months. A surprisingly strong May Jobs Report released on Friday had the 10-year Treasury yield, which is a direct driver of mortgage rates, rising the most in nearly two years. Roughly fifteen of seventeen within the Fed now believe that steps should be taken to normalize policy by increasing rates this year. Many analysts are predicting a rate hike by the end of the year as futures currently indicate a 68% chance the Fed will pull the trigger by December.
As the situation in the eurozone drags on, Greece has yet to reach a deal with its creditors after delaying its June 5th payment to the IMF. The debate between debt forgiveness (requested by Greece) vs. expanding austerity (requested by the EU) seems likely to continue until the end of June and may ultimately lead to a referendum by the Greek government as 75% of Greeks wish to remain in the European Union.
Watch for some technical pressure in the bond market this week as the supply of corporate issuances is higher than usual and will be countered by a fresh supply of government securities becoming available. This week the U.S. Treasury is scheduled to sell $58BB in 3-year, 10-year and 30-year securities. On Tuesday, $24BB in 3-year notes will be auctioned, followed by $21BB in 10-year notes on Wednesday and $13BB in 30-year bonds on Thursday.
This Week: On Tuesday look for Wholesale Inventories and on Thursday, Retail Sales and Business Inventories. On Friday watch for the Producer Price Index and Consumer Sentiment.
Treasury Yields closed relatively flat today with the yield on the mortgage rate-driven 10 year note down 3 basis points (bps) yielding 2.38% and the 30 year bond roughly unchanged yielding 3.11%.
ERATE's Daily Rate Summary
May 8, 2015
Jobs Report Day
The Fed is likely to keep any changes to monetary policy on ice as today's employment report did nothing to cause them to change course. Non-farm Payrolls for April increased by 223,000, slightly below the forecasted 230,000 target, yet strong enough to show that the dismal first quarter is in the rear view mirror and the second quarter is off to a good start. However the downward revision of March's employment number was concerning with only 85,000 jobs added, reflecting the lowest number of jobs created since June of 2012. The Unemployment Rate dropped to 5.4% from 5.5%, coming within striking distance of the 5.0%-5.2% target range which the Fed defines as full-employment. Overall this report reinforced a very bad first quarter and provides hope for a stronger start to the second quarter.
The Labor Force Participation Rate which reflects the percentage of working age Americans who are employed or seeking a job rose 0.1% to 62.8% from March's reading of 62.7%. That is up from a 35+ year low in labor participation. The Underemployment Rate which signals the number of Americans who want a job but have given up the search, as well as those who are working part time but would prefer a full-time job, dropped to 10.8% from 10.9%, marking the lowest level since August of 2008.
Private Sector Payrolls increased by 213,000, missing the forecast of 225,000. Average Hourly Earnings rose 0.1% compared to the forecasted 0.2%. The sectors with strong job growth included: business services, healthcare and construction while mining continued taking a hit in accordance with a strained energy industry.
In non-employment related economic news, Wholesale Inventories rose 0.1% in March missing the forecast of 0.3% and following a downward revision of February's number to 0.2% from 0.3%.
Treasury yields closed lower following several highly volatile weeks for the bond market, with the yield on the mortgage rate driving 10 year note down 4 basis point (bps) yielding 2.14% while the 30 year bond was down 1 basis points (bps) yielding 2.90%.
ERATE's Daily Rate Summary
May 7, 2015
The global bond market sell-off hit the pause button as upward spiraling yields pulled back down slightly helping to curtail the rapid rise in Treasury yields which sent the 30 year bond higher than 3 percent for the first time this year. Investors in sovereign debt holding negative or minimal yields were caught off guard by the abrupt rise in oil prices and began dumping German Bunds at a pace not seen in decades. U.S. Treasuries saw a technical rally under way as traders moved from equities into Treasuries in a risk-off trade. U.S. Treasuries are also benefiting from buying in Japan as well as a lack of new corporate bond issues present in the market.
U.S. Economic data released shows Weekly Initial Jobless Claims increasing by 3,000 last week to 265,000 when the consensus was looking for 278,000. In a rare move, the four week moving average fell below 280,000.
The markets hold their breath as they wait for the release of the April Jobs Report on Friday, where analysts are looking for an additional 230,000 jobs created for the month.
Treasury yields closed lower for a change, with the yield on the mortgage rate driving 10 year note down 7 basis point (bps) yielding 2.19% while the 30 year bond was down 9 basis points (bps) yielding 2.91%.
ERATE's Daily Rate Summary
May 6, 2015
The unprecedented global bond sell off sparked by the Euro zone countries has pushed bond yields to their highest levels of the year. There is no singular catalyst for the sell off other than a confluence of events which have now generated a loss of $430 billion in a very short period of time. Whether the cause is due to technical factors of crowded trades being squeezed out with fewer exit options as a result of a lack of liquidity, or whether a rise in oil prices sparked by the decline in the dollar as a result of events in Europe have led to an abrupt end to deflation fears, no one clear factor stands out. The bond market appears to be in unchartered territory now as typically correlated moves in the market have all but evaporated. Some analysts believe what is occurring now may be the result of the Quantitative Easing program (QE) beginning in Europe and look to similarities in Japan when they began their QE program in 2013 as a road map.
Economic news in the U.S. today showed non-farm productivity falling 1.9% as forecast and Unit Labor Costs rising 5.0% beating the forecasted 4.5% figure.
The big news in private payroll had the ADP National Employment Report reflecting an increase of 169,000 jobs in April when a rise of 200,000 was forecast. All eyes will be watching the U.S. Labor Department's release of the monthly Non-Farm Payroll Report which is due to be released this Friday and is expected to show a rise of 230,000 jobs for the month of April.
The MBA Mortgage Application Index fell 4.6% last week after falling 2.3% the prior week. The big drop in the Refinance Index was offset slightly by a rise in the Purchase Index.
Treasury yields closed higher yet again with the yield on the mortgage rate driving 10 year note up 7 basis point (bps) yielding 2.25% while the 30 year bond was also up 10 basis points (bps) yielding 3.01%.
ERATE's Daily Rate Summary April 29, 2015
The Fed ended its two day meeting today without any changes in rate hike expectations. No reference to a time line on the calendar was made to any upcoming Fed meeting and so it appears that the data dependent and meeting specific approach by the Fed will continue. The trend of disappointing economic news in the first quarter was framed by the Fed to have been the likely result of transitory factors occurring in the winter months. The committee also indicated it would like to see further improvement in the labor market, as well as gain confidence that the inflation rate is moving towards its 2% target before making a move. All of the aforementioned suggest that the wait may be pushed at least into the third quarter. Though the Fed did not rule out a rate hike at its June meeting, and though it may be leaning towards raising the Fed Funds rate, the economic data at this time does not warrant it. A consensus of economists see September as the likely time frame for the Fed's first rate hike since June of 2006, yet investors futures contracts point towards a December time line.
First quarter GDP results revealed growth at an anemic 0.2% annual rate, well below the 1.0% that was forecast. And on inflation, the GDP Price Index fell 0.1% when an increase of 0.5% was forecast while the core PCE Index, excluding food and energy, disappointed rising 0.9% when an increase of 1.0% was expected. However personal consumption figures were rosier than anticipated, rising 1.9% which was higher than the forecasted 1.7%.
Treasury yields closed higher with the yield on the mortgage rate driving 10 year note up 4 basis point (bps) yielding 2.05% and the 30 year bond rising 5 basis point (bps) yielding 2.76%.
ERATE's Daily Rate Summary April 28, 2015
Today the Fed began its scheduled two day meeting and is due to release its policy statement tomorrow at 2:00 pm. A crop of economic data falling below analysts' forecasts will likely result in the Fed leaving rates unchanged in the near term. A drop in energy sector production resulting from falling oil prices coupled with a fall in capital spending, along with the strength of the dollar, compounded by severe winter weather and port disruptions on the West Coast, all add up to a probable delay in pulling the trigger on the Fed's long anticipated rate increase.
Bond investors reduced their holdings today as a fresh supply of both Treasuries and corporate offerings became available this week. The Treasury Dept. conducts its auction of $90 billion in Treasuries of multiple maturities this week as several large corporate issues from Oracle and Amgen also compete for investor's cash.
Today's data on the economy revealed housing numbers that were better than forecast as the S&P/Case-Shiller index showed that home prices in 20 cities grew by 5.0% in February from a year ago when an increase of only 4.7% was expected. However U.S. consumer confidence figures disappointed as they fell to 95.2 in April from 101.4 in March.
Treasury yields closed at the high end of the trading range with the yield on the mortgage rate driving 10 year note up 8 basis point (bps) yielding 2.00% and the 30 year bond rising 9 basis point (bps) yielding 2.70%.
ERATE's Daily Rate Summary April 27, 2015
The early price decline seen in bonds eased later today as traders were hesitant to make bets ahead of the two day Fed meeting being tomorrow. The bond market has been stuck in a tight trading range since the Fed's previous meeting in March. No changes are anticipated by analysts at the Fed's upcoming meeting as the data dependent Fed has seen a rash of weaker than expected U.S. economic data recently. The strong dollar has hampered U.S. export activities so expectations remain that the Fed will maintain the near zero interest rate policy it has held since December of 2008.
U.S. service sector growth slowed more than forecast as the preliminary Markit U.S. Services PMI Index dropped to 57.8 in April from 59.2 in March. However a positive uptick in business activity was noted in April as well as a positive sign for payroll figures which reflected the fastest increase since June of 2014. But continuing with mixed bag results, the Dallas Fed Manufacturing Index revealed a decline in activity for the region which was more severe than expected.
Bond prices began the day on a weak note due to bond traders reducing their safe haven holding of U.S. Treasuries and German Bunds as Greek Debt yields dropped while negotiations surrounding Greece have made some apparent progress. The outcome in Greece will likely be the primary driver of U.S. Treasury prices until such time as the Fed makes a move on rates.
Treasury yields were relatively flat with the yield on the mortgage rate driving 10 year note up 1 basis point (bps) yielding 1.92% and the 30 year bond unchanged from Friday yielding 2.61%.
ERATE's Daily Rate Summary
April 24, 2015
U.S. Economic Data continued to weaken making a near term rate hike by the Fed less of a sure bet. While today's release of U.S. Durable Goods Orders for March jumped by the strongest number in eight months, increasing 4% from a drop of 1.4% in February, the report also showed declining demand with the exception of automobiles and aircrafts. Absent the transportation sector, durable goods orders have now fallen for six consecutive months. Even more concerning was the drop by 0.5% in demand for a critical component reflecting future business investment.
Treasury yields fell with the yield on the mortgage rate driving 10 year note down 5 basis points (bps) yielding 1.91% and the 30 year bond also down 4 bps yielding 2.61%.
A flood of weaker than expected economic data, occurring since the Feds previous meeting in March, has resulted in a number of economists downward revision of their 2015 outlook for the U.S. economy. A growing number of economists project that economic growth in the U.S. has slowed to 1-1.5% for the first quarter of 2015.
The two day Fed meeting will begin on Tuesday and no significant changes are anticipated at this time.
ERATE's Daily Rate Summary
April 23, 2015
U.S. Treasuries fell from the nearly four week highs reached yesterday as signs of weakness seeped back into the latest economic data. New home sales dropped unexpectedly to an annual rate of 481,000, down from February's revised robust number of 543,000. This decline represents an 11.4% drop. According to Wells Fargo Senior Economist Anika Kahn, mortgage loan applications, which are a leading indicator, are currently reflective of strength in the housing sector and the poor reading today may be more the result of a harsh winter shake off.
Treasury yields fell with the yield on the mortgage rate driving 10 year note down 2 basis points (bps) yielding 1.96% and the 30 year bond also down 2 bps yielding 2.65%.
Weekly initial jobless claims also rose by 1,000 reaching 295,000, this was above the estimated number of 287,000. April's preliminary Markit U.S. Manufacturing PMI index fell to 54.2 from March's 55.7 level as economists expected. Friday, watch for the release of the March Durable Goods Orders for another signal on the economy.
Mortgage Rates slightly lower per Fredde Mac Weekly Survey
Freddie Mac Primary Mortgage Market Weekly Survey Results
April 23, 2015
30 Year Fixed Rates
By region, Freddie Mac reports rates are slightly lower.
Northeast Region : 3.62% with 0.6 discount points
West Region : 3.62% with 0.7 discount points
Southeast Region : 3.77% with 0.5 discount points
North Central Region : 3.63% with 0.6 discount points
Southwest Region : 3.68% with 0.4 discount points
>>>>>>>>>
ERATE's Daily Rate Summary
April 22, 2015
The yields on U.S. Treasuries rose to their highest levels in weeks as investors sparked a broad selloff of low-risk government debt including holdings of German Bunds, British Gilts as well as U.S. Treasuries. Expectations that the Fed may move to finally increase rates this year heightened with stronger than anticipated figures in the housing market as March existing home sales hit the highest level in 18 months rising to an annualized rate of 5.19 million.
A positive signal for near term interest rates could be the apparent decoupling of the VIX and VSTOXX, measures of U.S. and European stock market volatility. While both have been closely correlated in the past, their recent divergence may signal of an easing of global systemic risk. The divergent policies of the global central banks, which have likely produced this uncoupling, may mean that the U.S. is importing lower rates from abroad. This is likely to create stability in mortgage rates, with the 10 year treasury hovering at or below 2% until such time as the European Central Bank and the Bank of Japan begin increasing rates.
Treasury yields closed mostly higher with the yield on the mortgage rate driving 10 year note up 7 basis points (bps) yielding 1.98% and the 30 year bond up 8 bps yielding 2.66%.
ERATE's Daily Rate Summary
April 21, 2015
The U.S. bond market reversed its early advance as treasury prices fell for the second consecutive day. Bond investors were resistant to add to their holdings absent any major economic data releases on the calendar. The bond market lacks conviction in any direction at this point ahead of next week's Fed policy meeting. Though it's anticipated that the Fed will not raise rates at their meeting next Wednesday, the consensus is that they will end their 6.5 year zero interest rate policy by the end of the year.
Treasury yields closed mostly lower with the yield on the mortgage rate driving 10 year note up 2 basis points (bps) yielding 1.91% and the 30 year bond also up 2 bps yielding 2.58%.
The biggest driver of the market activity today may be the on-going will they/won't they speculation on whether Greece will exit the EURO potentially sparking a drag down of all of Europe spreading onto the broader global economy.
Freddie Mac Primary Mortgage Market Weekly Survey Results
April 16, 2015
30 Year Fixed Rates
By region, Freddie Mac reports rates are slightly higher
Northeast Region : 3.65% with 0.7 discount points
West Region : 3.64% with 0.7 discount points
Southeast Region : 3.79% with 0.5 discount points
North Central Region : 3.64% with 0.6 discount points
Southwest Region : 3.71% with 0.5 discount points
>>>>>>>>>
Freddie Mac Primary Mortgage Market Weekly Survey Results
April 9, 2015
30 Year Fixed Rates
By region, Freddie Mac reports rates are lower!
Northeast Region : 3.66% with 0.5 discount points
West Region : 3.63% with 0.7 discount points
Southeast Region : 3.75% with 0.5 discount points
North Central Region : 3.62% with 0.5 discount points
Southwest Region : 3.68% with 0.6 discount points
>>>>>>>>>>
Primary Mortgage Market Survey Results
April 2, 2015
Rates in the West Region 3.67 average 0.5% with discount points required.
By region, Freddie Mac reports :
Northeast Region : 3.69% with 0.5 discount points
West Region : 3.67% with 0.7 discount points
Southeast Region : 3.8% with 0.5 discount points
North Central Region : 3.68% with 0.6 discount points
Southwest Region : 3.73% with 0.5 discount points
>>>>>>>>>>>>>>>>>>>>>>>>>>>>>>>>>>>>>>>>>>>>>>>>>>>
Primary Mortgage Market Survey Results
March 26, 2015
Rates in the West Region average 3.64% with 0.8 discount points required.
By region, Freddie Mac reports :
- Northeast Region : 3.69% with 0.5 discount points
- West Region : 3.64% with 0.8 discount points
- Southeast Region : 3.79% with 0.5 discount points
- North Central Region : 3.68% with 0.6 discount points
- Southwest Region : 3.74% with 0.5 discount points
>>>>>>>>>>>>>>>>>>>>>>>>>>>>>>>>>>>>>>>>>>>>>>>>>>>
Primary Mortgage Market Survey Results
March 19, 2015 Rates in the West Region average 3.76% with 0.7 discount points required.
By region, Freddie Mac reports :
- Northeast Region : 3.76% with 0.6 discount points
- West Region : 3.73% with 0.7 discount points
- Southeast Region : 3.87% with 0.5 discount points
- North Central Region : 3.77% with 0.7 discount points
- Southwest Region : 3.84% with 0.6 discount points
>>>>>>>>>>>>>>>>>>>>>>>>>>>>>>>>>>>>>>>>>>>>>>>>>>>
Primary Mortgage Market Survey Results
March 12, 2015
Rates in the West Region average 3.80% with 0.7 discount points required.
By region, Freddie Mac reports :
- Northeast Region : 3.86% with 0.5 discount points
- West Region : 3.80% with 0.7 discount points
- Southeast Region : 3.95% with 0.5 discount points
- North Central Region : 3.85% with 0.6 discount points
- Southwest Region : 3.89% with 0.6 discount points
>>>>>>>>>>>>>>>>>>>>>>>>>>>>>>>>>>>>>>>>>>>>>>>>>>>
Primary Mortgage Market Survey Results
March 5, 2015
Rates in the West Region average 3.70% with 0.6 discount points required.
By region, Freddie Mac reports :
- Northeast Region : 3.72% with 0.6 discount points
- West Region : 3.70% with 0.7 discount points
- Southeast Region : 3.84% with 0.5 discount points
- North Central Region : 3.73% with 0.7 discount points
- Southwest Region : 3.82% with 0.5 discount points
Mortgage Rates Drop
For the week ending January 13, 2015 the average conforming 30-year mortgage interest rate dropped to 3.84 percent. Last week the rate was 3.96 percent. For a year-over-year perspective, the average rate last year at this time was 4.63.
The national range for the 30-year rate varied, with lows at 3.57 percent and highs at 5.08 percent.
The average rate for the 15-year fixed rate mortgage (FRM) also dropped this week. The average rate for the week ending January 13, 2015 was 3.16, compared to 3.26 last week. A year ago, the rate averaged 3.67.
The low and high 15-year FRM rates came in at 2.92 percent and 4.07 percent, respectively.
Average rates for the 30-year jumbo loan were also included in the ERATE report. The average interest rate dropped to 3.96 percent for the week ending January 13, compared to 4.06 percent a week earlier. The rate was 4.60 percent a year ago. Rates ranged nationwide from 3.42 to 5.08.
Finally, average 5/1 ARM loan rates also posted a drop from last week. Average rates for the week ending January 13, were 2.97 percent, compared to 3.02% last week. The lowest 5/1 ARM rate in the country was 2.77 percent, and the highest 3.15% percent. The rate was 2.99% percent a year ago.
National APR (annual percentage rates) numbers in the ERATE Interest Rate Update are tallied from the interest rates of some 200 mortgage originators nationwide. Formed in 1999, erate.com is a financial information publisher and interest rate tracker.
Mortgage Rates Spike: ERATE Interest Rate Update
by Amy Lillard
Mortgage interest rates made major jumps across the board this week compared to last, according to the ERATE Interest Rate Update. After a couple weeks of steady rates, the spike may leave some buyers and market analysts concerned.
For the week ending August 20, 2013 the average conforming 30-year mortgage interest rate climbed to 4.78 percent. Last week the rate was 4.56 percent. For a year-over-year perspective, the average rate last year at this time was 3.92.
The national range for the 30-year rate varied, with lows at 3.59 percent and highs at 5.77 percent.
The average rate for the 15-year fixed rate mortgage (FRM) also increased this week. The average rate for the week ending August 20 was 3.76, compared to 3.60 last week. A year ago, the rate averaged 3.15.
The low and high 15-year FRM rates came in at 2.71 percent and 4.99 percent, respectively.
Average rates for the 30-year jumbo loan were also included in the ERATE report. The average interest rate rose to 4.82 percent for the week ending August 20, compared to 4.63 percent a week earlier. The rate was 4.26 percent a year ago. Rates ranged nationwide from 3.95 to 6.20.
Finally, average 5/1 ARM loan rates also posted a small jump over last week. Average rates for the week ending August 20 were 3.10 percent, compared to 3.07 last week. The lowest 5/1 ARM rate in the country was 2.60 percent, and the highest 4.08 percent. The rate was 3.12 percent a year ago.
National APR (annual percentage rates) numbers in the ERATE Interest Rate Update are tallied from the interest rates of some 200 mortgage originators nationwide. Formed in 1999, erate.com is a financial information publisher and interest rate tracker.
Mortgage Rates Drop: ERATE Interest Rate Update
by Amy Lillard
(8/14/2013) Mortgage interest rates posted declines across the board this week compared to last, according to the ERATE Interest Rate Update. After weeks of increases, the drop was a move in the right direction for consumers and housing market analysts alike.
For the week ending August 13, the average conforming 30-year mortgage interest rate decreased to 4.56 percent. Last week the rate was 4.60 percent. For a year-over-year perspective, the average rate last year at this time was 3.79.
The national range for the 30-year rate varied, with lows at 3.59 percent and highs at 5.69 percent.
The average rate for the 15-year fixed rate mortgage (FRM) also declined this week. The average rate for the week ending August 13 was 3.60, compared to 3.65 last week. A year ago, the rate averaged 3.05.
The low and high 15-year FRM rates came in at 2.71 percent and 4.99 percent, respectively.
Average rates for the 30-year jumbo loan were also included in the ERATE report. The average interest rate slid down to 4.63 percent for the week ending August 13, compared to 4.69 percent a week earlier. The rate was 4.20 percent a year ago. Rates ranged nationwide from 3.95 to 6.20.
Finally, average 5/1 ARM loan rates posted a small decline over last week. Average rates for the week ending August 13 were 3.07 percent, compared to 3.08 last week. The lowest 5/1 ARM rate in the country was 2.60 percent, and the highest 4.08 percent. The rate was 3.11 percent a year ago.
National APR (annual percentage rates) numbers in the ERATE Interest Rate Update are tallied from the interest rates of some 200 mortgage originators nationwide. Formed in 1999, erate.com is a financial information publisher and interest rate tracker.
Mortgage Rates Stay Steady: eRate Interest Rate Update
by Amy Lillard
(8/7/2013) Mortgage interest rates changed little this week compared to last, according to the eRate Interest Rate Update. This week's steady average rates were a change from a weeks-long trend of increases, providing a bit of good news for housing market analysts.
The average 30-year, conforming mortgage interest rate had a very slight increase to 4.60 percent the week ending August 6, from 4.58 percent last week. Last year at this time, the average was 3.76.
The national range for the 30-year rate varied, with lows at 3.74 percent and highs at 5.63 percent.
The 15-year fixed rate mortgage (FRM) stayed nearly the same this week. The average rate for the week ending August 6 was 3.65, compared to 3.64 last week. A year ago, the rate averaged 3.03.
The low and high 15-year FRM rates came in at 2.95 percent and 4.99 percent, respectively.
Erate also reported on average rates for the 30-year jumbo loan. The average interest rate inched up to 4.69 percent for the week ending August 6, compared to 4.67 percent a week earlier. The rate was 4.14 percent a year ago. Rates ranged from 3.95 to 6.20.
The 5/1 ARM loan rates also stayed nearly the same across the board this week. Average rates for the week ending August 6 were 3.08 percent, compared to 3.09 last week. The lowest 5/1 ARM rate was 2.58 percent, and the high 4.08 percent. The rate was 3.11 percent a year ago.
Erate's National APR (annual percentage rates) numbers are tallied from the interest rates of some 200 mortgage originators nationwide. Erate.com is a financial information publisher and interest rate tracker formed in 1999.
Mortgage Rates Climb Slowly: eRate Interest Rate Update
by Amy Lillard
(7/30/2013)Mortgage interest rates were up across the board this week, continuing a weeks-long trend, according to the eRate Interest Rate Update.
The average 30-year, conforming mortgage interest rate edged up to 4.58 percent the week ending July 30, up from 4.52 percent last week. Last year at this time, the average rate was 3.78.
The national range for the 30-year rate varied, with lows at 3.72 percent and highs at 5.62 percent.
For 15-year fixed rate mortgages (FRM) rates also rose slightly. The average rate for the week ending July 30 was 3.64, compared to 3.60 last week. A year ago, the rate averaged 3.06.
The low and high 15-year FRM rates came in at 2.97 percent and 4.99 percent, respectively.
Erate also reported on average rates for 30-year jumbo loans. The average interest rate moved up to 4.67 percent for the week ending July 30, compared to 4.58 percent a week earlier. The rate was 4.16 percent a year ago. Rates ranged from 4.07 to 6.20.
For the 5/1 ARM loan, rates remained nearly the same at 3.09 percent, compared to 3.08 last week. The lowest 5/1 ARM rate was 2.58 percent, and the high, 4.08 percent. The rate was 3.12 percent a year ago.
Erate's National APR (annual percentage rates) numbers are tallied from the interest rates of some 200 mortgage originators nationwide. Erate.com is a financial information publisher and interest rate tracker formed in 1999.
Find The Lowest Mortgage Rates
Refinance Rates & Home Purchase Rates
Just One Click! = Current Rate Chart
Rates on 30 year mortgage hits 2 year high
by Jeff Howard
(7/11/2013) – The average rate on the 30-year fixed-rate mortgage (FRM) came in at 4.51 percent, with an average 0.8 point, the week ending July 11, 2013 according to Freddie Mac's weekly Primary Mortgage Market Survey.
Last week, the 30-year FRM averaged 4.29 percent. It was 3.56 percent a year ago.
Meanwhile, the average interest rate on the 15-year FRM was 3.53 percent, with an average 0.8 point, up from last week when it averaged 3.39 percent. A year ago, the 15-year FRM averaged 2.86 percent.
For the 5-year Treasury-indexed hybrid adjustable rate mortgage (ARM), the average interest rate was 3.26 percent, with an average 0.7 point, up form 3.10 percent last week, and up from the average 2.74 percent a year ago.
Finally, for the week ending May 30, Freddie Mac reported the 1-year Treasury-indexed ARM averaged 2.66 percent, with an average 0.5 point, the same as last week, and down from 2.69 percent a year ago.
Most benchmark mortgage rates up this week
by Jeff Howard
(6/27/2013) – Most major mortgage interest rates were on the rise this week, a trend in affect for a few weeks, according to the Erate Interest Rate Update
Wall Street has been experiencing a downward move for the last four weeks.
Meanwhile, the average on the major benchmark 30-year, conforming mortgage interest rate jumped to 4.63 percent the week ending June 25, up from 4.16 percent last week.
The 30-year rate ranged from 3.45 percent to 5.43 percent for the week. A year ago, the rate was 3.90 percent.
The average rate for the 15-year fixed rate mortgage (FRM) was also up from 3.28 percent last week to 3.72 percent, according to Erate.com, a financial information publisher and interest rate tracker since 1999.
The high and low 15-year FRM rates came in at 4.74 percent and 2.79 percent, respectively. A year ago, the rate averaged 3.16 percent.
Meanwhile, Erate reported the average interest rate for the 30-year jumbo loan ticked up to 4.71 percent, the week ending June 25, compared to 4.26 percent a week earlier. The rate was 4.36 percent a year ago and the spread ranged from 3.70 percent, at the low end, to 6.33 percent at the high end.
The average interest rate for the 5/1 ARM was up at 3.09 percent. The lowest 5/1 ARM rate was 2.51 percent, and the high, 4.08 percent. The rate was 3.15 percent a year ago.
Erate's National APR (annual percentage rates) numbers are tallied from the interest rates of some 200 mortgage originators nationwide.
30 Year fixed rate take a short break and drop some! *
by Jeff Howard
(6/20/2013) – The average rate on the 30-year fixed-rate mortgage (FRM) came in at 3.93 percent, with an average 0.8 point, the week ending June 20, 2013 according to Freddie Mac's weekly Primary Mortgage Market Survey.
Last week, the 30-year FRM averaged 3.98 percent. It was 3.66 percent a year ago.
Meanwhile, the average interest rate on the 15-year FRM was 3.04 percent, with an average 0.7 point, down from last week when it averaged 3.10 percent. A year ago, the 15-year FRM averaged 2.95 percent.
For the 5-year Treasury-indexed hybrid adjustable rate mortgage (ARM), the average interest rate was 2.79 percent, with an average 0.5 point, same as 2.79 percent last week, and down from the average 2.77 percent a year ago.
Finally, for the week ending May 30, Freddie Mac reported the 1-year Treasury-indexed ARM averaged 2.57 percent, with an average 0.4 point, down from last when it average 2.58, and down from 2.74 percent a year ago.
* Keep in mind that this is a survey put on by Freddie Mac and although it is dated today (6/20/13)I have noticed that the rates being quoted by lenders today are higher than they were last week
30 Year fixed rate mortgage rise to 14 month high!
by Jeff Howard
(6/13/2013) – The average rate on the 30-year fixed-rate mortgage (FRM) came in at 3.98 percent, with an average 0.7 point, the week ending June 13, 2013 according to Freddie Mac's weekly Primary Mortgage Market Survey.
Last week, the 30-year FRM averaged 3.91 percent. It was 3.71 percent a year ago.
Meanwhile, the average interest rate on the 15-year FRM was 3.10 percent, with an average 0.7 point, up from last week when it averaged 3.03 percent. A year ago, the 15-year FRM averaged 2.98 percent.
For the 5-year Treasury-indexed hybrid adjustable rate mortgage (ARM), the average interest rate was 2.79 percent, with an average 0.6 point, up from 2.74 percent last week, and down from the average 2.8 percent a year ago.
Finally, for the week ending May 30, Freddie Mac reported the 1-year Treasury-indexed ARM averaged 2.58 percent, with an average 0.4 point, the same as last week, and down from 2.78 percent a year ago.
Fixed mortgage rates still climbing
by Jeff Howard
(6/6/2013) – The average rate on the 30-year fixed-rate mortgage (FRM) came in at 3.91 percent, with an average 0.7 point, the week ending June 6, 2013 according to Freddie Mac's weekly Primary Mortgage Market Survey.
Last week, the 30-year FRM averaged 3.81 percent. 
Meanwhile, the average interest rate on the 15-year FRM was 3.03 percent, with an average 0.7 point, up from last week when it averaged 2.98 percent.
For the 5-year Treasury-indexed hybrid adjustable rate mortgage (ARM), the average interest rate was 2.74 percent, with an average 0.5 point, up from 2.66 percent last week.
Finally, for the week ending May 30, Freddie Mac reported the 1-year Treasury-indexed ARM averaged 2.58 percent, with an average 0.4 point, down from 2.54 percent last week.
Find The Lowest Mortgage Rates
Refinance Rates & Home Purchase Rates
Just One Click! = Current Rate Chart

Fixed Mortgage Rates hit 12 Month High!
by Jeff Howard
(5/30/2013) – The average rate on the 30-year fixed-rate mortgage (FRM) came in at 3.81 percent, with an average 0.8 point, the week ending May 30, 2013 according to Freddie Mac's weekly Primary Mortgage Market Survey.
Last week, the 30-year FRM averaged 3.59 percent. It was 3.75 percent a year ago.
Meanwhile, the average interest rate on the 15-year FRM was 2.98 percent, with an average 0.7 point, up from last week when it averaged 2.77 percent. A year ago, the 15-year FRM averaged 2.97 percent.
For the 5-year Treasury-indexed hybrid adjustable rate mortgage (ARM), the average interest rate was 2.66 percent, with an average 0.5 point, up from 2.63 percent last week, and down from the average 2.84 percent a year ago.
Finally, for the week ending May 30, Freddie Mac reported the 1-year Treasury-indexed ARM averaged 2.54 percent, with an average 0.5 point, down from 2.55 percent last week, and down from 2.75 percent a year ago. Does anyone originate these 1-year ARMs anymore?
Attributed to Frank Nothaft, vice president and chief economist, Freddie Mac.
"Fixed mortgage rates followed long-term government bond yields higher following a growing market sentiment that the Federal Reserve may lessen its accommodative policy stance. Improving economic data may have encouraged those views. For instance, the Conference Board reported that confidence among consumers rose in May to its highest level since February 2008. Meanwhile, the S&P/Case-Shiller® 20-city composite index for March rose to its highest reading since November 2008 (seasonally adjusted).All 20 cities had positive monthly gains, led by a 3.2 percent increase in Las Vegas."
Mortgage interest rates rise
by Corbin Perkins
DeadlineNews.Com
The average rate on the 30-year fixed-rate mortgage (FRM) came in at 3.42 percent, with an average 0.7 point, the week ending May 9, according to Freddie Mac's weekly Primary Mortgage Market Survey.
Last week, the 30-year FRM averaged 3.35 percent. It was 3.83 percent a year ago.
Meanwhile, the average interest rate on the 15-year FRM was 2.61 percent, with an average 0.7 point, up from last week when it averaged 2.56 percent. A year ago, the 15-year FRM averaged 3.05 percent.
"Fixed mortgage rates edged up following a solid employment report for April. The economy gained 165,000 new jobs on net last month, more than the market consensus forecast and the largest monthly increase this year. On top of that, revisions added 114,000 more jobs to February and March as well. All of these factors allowed the unemployment rate to fall to 7.5 percent in April, the lowest since December 2008," says Frank Nothaft, vice president and chief economist at Freddie Mac.
For the 5-year Treasury-indexed hybrid adjustable rate mortgage (ARM), the average interest rate was 2.58 percent, with an average 0.5 point, up from 2.56 percent last week, and down from the average 2.81 percent a year ago.
Finally, for the week ending May 9, Freddie Mac reported the 1-year Treasury-indexed ARM averaged 2.53 percent, with an average 0.4 point was the only rate to drop down from 2.56 percent last week. It was also down from 2.73 percent a year ago.
Find The Lowest Mortgage Rates
Refinance Rates & Home Purchase Rates
Just One Click! = Current Rate Chart

Most benchmark mortgage rates up this week
by Broderick Perkins
(5/7/2013) – Most major mortgage interest rates were on the rise this week, after other rate surveys saw rates fall to record lows for the past two weeks, according to the Erate Interest Rate Update.
Some buoyancy came from Wall Street investment markets. On a tear for the past week, the Dow closed on May 7 above 15,000 for the first time ever. Investors also pushed the S&P 500 to a new record of 1,625.96.
Meanwhile, the average on the major benchmark 30-year, conforming mortgage interest rate jumped to 3.63 percent the week ending May 7, up from 3.59 percent last week.
The 30-year rate ranged from 3.22 percent to 5.38 percent for the week. A year ago, the rate was 4.05 percent.
The average rate for the 15-year fixed rate mortgage (FRM) was also up from 2.79 percent last week to 2.83 percent, according to Erate.com, a financial information publisher and interest rate tracker since 1999.
The high and low 15-year FRM rates came in at 4.02 percent and 2.28 percent, respectively. A year ago, the rate averaged 3.26 percent.
Meanwhile, Erate reported the average interest rate for the 30-year jumbo loan ticked up to 3.87 percent, the week ending May 7, compared to 3.84 percent a week earlier. The rate was 4.48 percent a year ago and the spread ranged from 3.42 percent, at the low end, to 6.33 percent at the high end.
The average interest rate for the 5/1 ARM was unchanged at 2.88 percent. The lowest 5/1 ARM rate was 2.44 percent, and the high, 4.08 percent. The rate was 3.14 percent a year ago.
Home equity rates flat
The average variable rate on home equity lines of credit (HELOC) was also unchanged at 4.61 percent. The rate averaged 4.65 percent a year ago. The lowest HELOC rate was 2.50 percent and the high, 8.50 percent.
The average FRM rate on 15-year home equity loans, was likewise unchanged at 6.05 percent. Home equity rates ranged from 2.50 percent to 9.95 percent. The average was 6.35 percent a year ago.
Erate's National APR (annual percentage rates) numbers are tallied from the interest rates of some 200 mortgage originators nationwide.
Mortgage rates continue run on record lows
by Corbin Perkins
DeadlineNews.Com
(5/2/2013) - Average interest rates for both the 15-year fixed rate mortgage (FRM) and the 5-year adjustable rate mortgage (ARM) fell to new record lows, both for the second consecutive week, according to Freddie Mac's weekly Primary Mortgage Market Survey for the week ending May 2.

Even as housing remains the economy's strongest cornerstone, rates were being pushed lower by overall economic performance that's below expectations, according to Frank Nothaft, vice president and chief economist of Freddie Mac.
"Mortgage rates eased somewhat following the release of the advance estimate of real Gross Domestic Product (GDP) growth for the first quarter of the year, which rose 2.5 percent, but fell short of the market consensus forecast," Nothaft said.
The economy may be limping along, but housing growth continues and appears permanent for the current cycle.
"Residential fixed investment … over the past eight consecutive quarters … contributed more than 0.3 percentage points in growth over the first three months of this year. Moreover, near record low mortgage rates should further drive the housing market recovery over the near term," Nothaft added.
Meanwhile, for the week ending May 2, the average rate on the 30-year FRM came in at 3.35 percent, with an average 0.7 point. That's just above the rate's all-time record low of 3.31 percent, set the week of November 21, 2012.
Last week, the 30-year FRM averaged 3.40 percent. It was 3.84 percent a year ago.
The average interest rate on the 15-year FRM was a new record low of 2.56 percent, with an average 0.7 point, down from last week when it averaged 2.61 percent. A year ago, the 15-year FRM averaged 3.07 percent.
For the 5-year Treasury-indexed hybrid ARM, the average interest rate was 2.56 percent, also a new record low, with an average 0.5 point, down from 2.58 percent last week, and down from the average 2.85 percent a year ago.
Finally, for the week ending May 2, Freddie Mac reported the 1-year Treasury-indexed ARM averaged 2.56 percent, with an average 0.3 point, down from 2.62 percent last week, and down from 2.70 percent a year ago.
Find The Lowest Mortgage Rates
Refinance Rates & Home Purchase Rates
Just One Click! = Current Rate Chart

Benchmark mortgage interest rates continue slide
by Broderick Perkins
DeadlineNews.Com
(4/30/2013) – The average on the major benchmark 30-year, conforming mortgage interest rate slipped to 3.59 percent the week ending April 30, down from 3.64 percent last week, according to the Erate Interest Rate Update.
The 30-year rate ranged from 3.22 percent to 5.38 percent for the week. A year ago, the rate was 4.07 percent.
The average rate for the 15-year fixed rate mortgage (FRM) was also down to 2.79 percent, from 2.83 percent a week ago, according to Erate.com, a financial information publisher and interest rate tracker since 1999.
The high and low 15-year FRM rates came in at 4.02 percent and 2.25 percent, respectively, both also down from a week ago. A year ago, the rate averaged 3.31 percent.
Meanwhile, Erate reported the average interest rate for the 30-year jumbo loan ticked up to 3.84 percent, the week ending April 30, compared to 3.83 percent a week earlier. The rate was 4.48 percent a year ago and the spread ranged from 3.38 percent, at the low end, to 6.33 percent at the high end.
The average interest rate for the 5/1 ARM also came down to 2.88 percent, from 2.90 percent a week ago. The lowest 5/1 ARM rate was 2.44 percent, and the high, 4.08 percent. The rate was 3.14 percent a year ago.
Home equity rates mixed
The average variable rate on home equity lines of credit (HELOC) ticked up to 4.61 percent, after languishing at 4.60 percent for more than a month. The rate averaged 4.65 percent a year ago. The lowest HELOC rate was 2.50 percent and the high, 8.50 percent.
The average FRM rate on 15-year home equity loans, went the other way, ticking down to 6.05 percent after two weeks at 6.06 percent. Rates ranged from 2.50 percent to 9.95 percent. The average was 6.35 percent a year ago.
Erate's National APR (annual percentage rates) numbers are tallied from the interest rates of some 200 mortgage originators nationwide.
Mixed economy pushes 15-year FRM and 5-year ARM to record lows
by Corbin Perkins
DeadlineNews.Com
(4/25/2013) – Falling prices at the pump weren't enough to offset the impact of the global economy running out of gas.
The average rate on the 30-year fixed-rate mortgage (FRM) came in at 3.40 percent, with an average 0.8 point, the week ending April 25, according to Freddie Mac's weekly Primary Mortgage Market Survey.
Last week, the 30-year FRM averaged 3.41 percent. It was 3.88 percent a year ago.
Meanwhile, gasoline prices fell 30 cents a gallon since the high of $3.80 a gallon earlier this year. Falling oil prices pushed down the price at the pump.
Capital Economics reported if prices slip below $3.40 a gallon this summer, as expected, consumers will have more money to spend on other items including cloths, electronics and entertainment.
That kind of good news would give interest rates a boost. However, the International Monetary Fund recently slashed it's outlook for global growth to only 3.3 percent – still a level seen as Pollyannaish.
Mortgage rates continued to fall, in some cases to new record lows.
The average interest rate on the15-year FRM fell to 2.61 percent, a new record low, with an average 0.7 point, down from last week when it averaged 2.64 percent. A year ago, the 15-year FRM averaged 3.12 percent.
For the 5-year Treasury-indexed hybrid adjustable rate mortgage (ARM), the average interest rate was 2.58 percent, also a new record low, with an average 0.5 point, down from 2.60 percent last week, and down from the average 2.85 percent a year ago.
Finally, for the week ending April 25, Freddie Mac reported the 1-year Treasury-indexed ARM averaged 2.62 percent, with an average 0.3 point, down from 2.63 percent last week, and down from 2.74 percent a year ago.
Home sales decline, low inflation push 30-year fixed rates closer to 3.5% mark
by Broderick Perkins
DeadlineNews.Com
(4/23/2013) – The average on the major benchmark 30-year, conforming mortgage interest rate slipped to 3.64 the week ending April 23, after remaining at 3.66 percent for the previous two weeks, according to the Erate Interest Rate Update.
The decline came after news that home sales slipped 0.6 percent from February to March, according to the National Association of Realtors.
Meanwhile, Federal Reserve officials worried over the rate of inflation slipping to 1.3 percent.
"That's pretty low. I'm getting concerned about that, and I think that gives the FOMC (Federal Reserve Open Market Committee) some room to maneuver on its monetary policy," said St. Louis Federal Reserve Bank President James Bullard, during a recent Levy Economics Institute event.
The 30-year rate ranged from 3.29 percent to 5.38 percent for the week. A year ago, the rate was 4.07 percent.
The average rate for the 15-year fixed rate mortgage (FRM) was also down to 2.83 percent, from 2.86 percent a week ago, according to Erate.com, a financial information publisher and interest rate tracker since 1999.
The high and low 15-year FRM rates came in at 4.07 percent and 2.27 percent, respectively. A year ago, the rate averaged 3.31 percent.
Meanwhile, Erate reported the average interest rate for the 30-year jumbo loan also fell, to 3.83 percent, the week ending April 23, down from 3.85 percent. The rate was 4.50 percent a year ago. The spread ranged from 3.43 percent, at the low end, to 6.33 percent at the high end.
The average interest rate for the 5/1 ARM was unchanged at 2.90 percent. Also unchanged were the lowest 5/1 ARM rate, 2.44 percent, and the high, 4.10 percent. The rate was 3.14 percent a year ago.
Home equity rates mixed
The average variable rate on home equity lines of credit (HELOC) was unchanged at 4.60 percent for the fifth week in a row. The rate averaged 4.66 percent a year ago. The lowest HELOC rate was 2.50 percent and the high, 8.50 percent.
The average FRM rate on 15-year home equity loans was also unchanged from last week at 6.06 percent. Rates ranged from 2.50 percent to 9.95 percent. The average was 6.36 percent a year ago.
Erate's National APR (annual percentage rates) numbers are tallied from the interest rates of some 200 mortgage originators nationwide.
Mortgage rates slip closer to record lows
by Corbin Perkins
DeadlineNews.Com
(4/18/2013) – The average rate on the 30-year fixed-rate mortgage (FRM) came in at 3.41 percent, with an average 0.7 point, the week ending April 18, according to Freddie Mac's weekly Primary Mortgage Market Survey.
Last week, the 30-year FRM averaged 3.43 percent. It was 3.90 percent a year ago.
Meanwhile, the average interest rate on the 15-year FRM was 2.64 percent, with an average 0.7 point, for the week ending April 18, down from last week when it averaged 2.65 percent. A year ago, the 15-year FRM averaged 3.13 percent.
For the 5-year Treasury-indexed hybrid adjustable rate mortgage (ARM), the average interest rate was 2.60 percent, with an average 0.5 point, also down from 2.62 percent last week, and down from the average 2.78 percent a year ago.
Finally, for the week ending April 18, Freddie Mac reported the 1-year Treasury-indexed ARM averaged 2.63 percent, with an average 0.4 point. It was the only rate to rise. It was up from 2.62 percent last week, and down from 2.81 percent a year ago.
Rates remain low, with mixed movement
by Broderick Perkins
DeadlineNews.Com
(4/16/2013) – The average on the major benchmark 30-year, conforming mortgage interest rate was unchanged from last week at 3.66 the week ending April 16, according to the Erate Interest Rate Update.
The 30-year rate ranged from 3.31 percent to 5.38 percent for the week. A year ago, the rate was 4.09 percent.
The average rate for the 15-year fixed rate mortgage (FRM) ticked down to 2.86 percent, from 2.87 percent a week ago, according to Erate.com, a financial information publisher and interest rate tracker since 1999.
The high and low 15-year FRM rates came in at 4.11 percent and 2.27 percent, respectively. A year ago, the rate averaged 3.32 percent.
Meanwhile, Erate reported the average interest rate for the 30-year jumbo loan also fell, to 3.85 percent, the week ending April 16, down from 3.91 percent. The rate was 4.51 percent a year ago. The spread ranged from 3.31 percent, at the low end, to 6.33 percent at the high end.
The average interest rate for the 5/1 ARM ticked up again to 2.90 percent, from 2.89 percent last week. The lowest 5/1 ARM rate this week was 2.44 percent and the high, 4.10 percent. The rate was 3.14 percent a year ago.
Home equity rates mixed
The average variable rate on home equity lines of credit (HELOC) was unchanged at 4.60 percent for the fourth week in a row. The rate averaged 4.66 percent a year ago. The lowest HELOC rate was 2.50 percent and the high, 8.50 percent.
The average FRM rate on 15-year home equity loans slipped for the second week, falling to 6.06 percent, down from 6.12 percent last week. Rates ranged from 2.50 percent to 9.95 percent. The average was 6.38 percent a year ago.
Erate's National APR (annual percentage rates) numbers are tallied from the interest rates of some 200 mortgage originators nationwide.
Continued lackluster job market pushes mortgage rates lower
by Corbin Perkins
DeadlineNews.Com
(4/11/2013) – With the economy producing fewer jobs than it's losing and more workers leaving the workforce, mortgage rates have no where to go but down.
The average rate on the 30-year fixed-rate mortgage (FRM) came in at 3.43 percent, with an average 0.8 point, the week ending April 11, according to Freddie Mac's weekly Primary Mortgage Market Survey.
Last week, the 30-year FRM averaged 3.54 percent. It was 3.88 percent a year ago.
Meanwhile, the average interest rate on the 15-year FRM was 2.65 percent, with an average 0.7 point, for the week ending April 11, down from last week when it averaged 2.74 percent. A year ago, the 15-year FRM averaged 3.11 percent.
"Mortgage rates fell further this week following a lackluster employment report for March. The economy added just 88,000 net new jobs last month, about one-third as many as February and the fewest since June 2012," said Frank Nothaft, vice president and chief economist of Freddie Mac.
"In addition, approximately 496,000 people left the workforce causing the unemployment rate to fall to 7.6 percent. Further, average hourly earnings were unchanged in March, indicating income growth remains tepid," he added
What's more, while the national unemployment rate has fallen from 8.2 percent to 7.6 percent over the past year, the averagerate for the 372 metropolitan areas tracked by the U.S. Bureau of Labor Statistics remains at 8.1 percent.
For the 5-year Treasury-indexed hybrid adjustable rate mortgage (ARM), the average interest rate was 2.62 percent, with an average 0.5 point, down from 2.65 percent last week and down from the average 2.85 percent a year ago.
Finally, for the week ending April 11, Freddie Mac reported the 1-year Treasury-indexed ARM averaged 2.62 percent, with an average 0.3 point, down a notch from 2.63 percent last week, and down from 2.80 percent a year ago.
Benchmark 30-year mortgage rate edges nearer 3.5%
by Broderick Perkins
DeadlineNews.Com
(4/9/2013) – After falling for the fourth consecutive week, the average on the major benchmark 30-year, conforming mortgage interest rate fell to 3.66 percent, down from 3.78 percent, the week ending April 9, according to the Erate Interest Rate Update.
The 0.12 percentage point difference was the fourth consecutive weekly drop and one of the largest slips this year. the 30-year rate ranged from 3.34 percent to 5.38 percent for the week. A year ago, the rate was 4.13 percent.
The average rate for the 15-year fixed rate mortgage (FRM), down nearly as much, dropped to 2.87 percent, from 2.97 percent a week ago, according to Erate.com, a financial information publisher and interest rate tracker since 1999.
The high and low 15-year FRM rates came in at 4.11 percent and 2.32 percent, respectively. A year ago, the rate averaged 3.36 percent.
Meanwhile, Erate reported the average interest rate for the 30-year jumbo loan fell to 3.91 percent, the week ending April 9, down from 4.03 percent. The rate was 4.57 percent a year ago. The spread ranged from 3.3 percent, at the low end, to 6.33 percent at the high end.
The average interest rate for the 5/1 ARM ticked down to 2.89 percent, from 2.90 percent last week. The lowest 5/1 ARM rate this week was 2.45 percent and the high, 4.10 percent. The rate was 3.16 percent a year ago.
Home equity rate movement varied
The average variable rate on home equity lines of credit (HELOC) was unchanged at 4.60 percent for the third week in a row. The rate averaged 4.65 percent a year ago. The lowest HELOC rate was 2.50 percent and the high, 8.50 percent.
The average FRM rate on 15-year home equity loans continued to inch down, falling to 6.11 percent, down from 6.13 percent last week. Rates ranged from 2.50 percent to 9.95 percent. The average was 6.38 percent a year ago.
Erate's National APR (annual percentage rates) numbers are tallied from the interest rates of some 200 mortgage originators nationwide.
Anemic economy puts downward pressure on benchmark mortgage rates
by Corbin Perkins
DeadlineNews.Com
(4/4/2013) – The anemic economy is still causing hundreds of thousands of workers to lose jobs every week and that's contributing to the downward pressure on mortgage interest rates.
The average rate on the 30-year fixed-rate mortgage (FRM) came in at 3.54 percent, with an average 0.8 point, the week ending April 4, according to Freddie Mac's weekly Primary Mortgage Market Survey.
Last week, the 30-year FRM averaged 3.57 percent. It was 3.98 percent a year ago.
Meanwhile, the average interest rate on the 15-year FRM was 2.74 percent, with an average 0.7 point, for the week ending April 4, down from last week when it averaged 2.76 percent. A year ago, the 15-year FRM averaged 3.21 percent.
Economic analysts expected the number of initial claims for unemployment benefits to drop to 345,000, but the U.S. Labor Department reported 385,000 people filed for those initial jobless benefits this week.
For the 5-year Treasury-indexed hybrid adjustable rate mortgage (ARM), the average interest rate was 2.65 percent, with an average 0.5 point, down from 2.68 percent last week, and down from the average 2.986 percent a year ago.
Finally, for the week ending April 4, Freddie Mac reported the only rate to rise was the 1-year Treasury-indexed ARM. It averaged 2.63 percent, with an average 0.4 point, up from 2.62 percent last week, and down from 2.78 percent a year ago.
Most benchmark mortgage interest rates inch down for third week
by Broderick Perkins
(4/2/2013) – Consumer confidence continued to worry down mortgage rates as many rates fell for the third consecutive week, according to the Erate Interest Rate Update for the week ending April 2.
The average 30-year, conforming mortgage interest rate fell to 3.78 percent, down from 3.80 percent, the week ending April 2.
Erate reported the 30-year rate ranged from 3.34 percent to 5.38 percent for the week. A year ago, the rate was 4.19 percent.
The average rate for the 15-year fixed rate mortgage (FRM), 2.97 percent, off a notch from 2.98 percent a week ago, according to Erate.com, a financial information publisher and interest rate tracker since 1999.
The high and low 15-year FRM rates came in at 4.11 percent and 2.52 percent, respectively and both down from a week ago. A year ago, the rate averaged 3.45 percent.
Interest rate movement is following consumers' doubts about the economy.
The Conference Board's Consumer Confidence index fell to 59.7 in March from 68 in February.
The 59.7 reading is well off the 92.86 average from 1967 until 2013 and far below the all time high of 144.70 in January of 2000. It's also almost half the numerous above 100 readings spanning much of the period from 2006 to 2007, at the peak of the last housing boom.
Meanwhile, Erate reported the average interest rate for the 30-year jumbo loan remained unchanged at 4.03 percent, for the week ending April 2. The rate was 4.74 percent a year ago. The spread ranged from 3.45 percent, at the low end, to 6.33 percent at the high end, unchanged from last week.
The average interest rate for the 5/1 ARM came down to 2.90 percent, from 2.91 percent last week. The lowest 5/1 ARM rate this week was 2.42 percent and the high 4.10 percent. The rate was 3.18 percent a year ago.
Home equity rates flat
The average variable rate on home equity lines of credit (HELOC) was unchanged at 4.60 percent for the second week in a row. The rate averaged 4.66 percent a year ago. The lowest HELOC rate was 2.50 percent and the high, 8.50 percent.
The average FRM rate on 15-year home equity loans moved for the first time in four weeks, rising to 6.13 percent, up from 6.12 percent for the past four week. Rates ranged from 2.50 percent to 9.95 percent. The average was 6.40 percent a year ago.
Erate's National APR (annual percentage rates) numbers are tallied from the interest rates of some 200 mortgage originators nationwide.
Mortgage interest rates on a roller coaster ride
by Broderick Perkins
DeadlineNews.Com
(3/28/2013) – Mortgage interest rates remain in record low territory, but they are taking the market on a roller-coaster ride, down one week, up the next.
This week they took a ride up, but generally remain flat.
The average rate on the 30-year fixed-rate mortgage (FRM) came in at 3.57 percent, with an average 0.8 point, the week ending March 28, according to Freddie Mac's weekly Primary Mortgage Market Survey.
Last week, the 30-year FRM averaged 3.54 percent. It was 3.99 percent a year ago.
Despite this year's ups and downs, the rate has remained below 4 percent for more a year, boosting the housing recovery.
Meanwhile, the average interest rate on the 15-year FRM was 2.76 percent, with an average 0.7 point, for the week ending March 28, up from last week when it averaged 2.72 percent. A year ago, the 15-year FRM averaged 3.23 percent.
For the 5-year Treasury-indexed hybrid adjustable rate mortgage (ARM), the average interest rate was 2.68 percent, with an average 0.6 point, up from 2.61 percent last week, and down from the average 2.90 percent a year ago.
Finally, for the week ending March 28, Freddie Mac reported the 1-year Treasury-indexed ARM averaged 2.62 percent, with an average 0.3 point, down from 2.63 percent last week, and down from 2.78 percent a year ago.
Most benchmark mortgage interest rates inch down for second week
by Broderick Perkins
DeadlineNews.Com
(3/26/2013) – Consumer confidence worried mortgage rates down this week as many rates fell for the second consecutive week, according to the Erate Interest Rate Update for the week ending March 26.
The average 30-year, conforming mortgage interest rate fell to 3.80 percent, down from 3.81 percent, the week ending March 26.
Erate reported the 30-year rate ranged from 3.34 percent to 5.38 percent for the week. A year ago, the rate was 4.22 percent.
The average rate for the 15-year fixed rate mortgage (FRM), 2.98 percent, was also down, from 2.95 percent a week ago, according to Erate.com, a financial information publisher and interest rate tracker since 1999.
The high and low 15-year FRM rates came in at 4.20 percent and 2.54 percent, respectively. A year ago, the rate averaged 3.44 percent.
Interest rate movement is following consumers' doubts about the economy.
The Conference Board's Consumer Confidence index fell to 59.7 in March from 68 in February.
The 59.7 reading is well off the 92.86 average from 1967 until 2013 and far below the all time high of 144.70 in January of 2000. It's also almost half the numerous above 100 readings spanning much of the period from 2006 to 2007, at the peak of the last housing boom.
Meanwhile, Erate reported the average interest rate for the 30-year jumbo loan ticked down to 4.03 percent, for the week ending March 26, from 4.04 percent, a week earlier. The rate was 4.73 percent a year ago. The spread ranged from 3.45 percent, at the low end, to 6.33 percent at the high end.
The average interest rate for the 5/1 ARM inched up to 2.91 percent, from 2.90 percent last week. The lowest 5/1 ARM rate this week was 2.42 percent and the high 4.08 percent. The rate was 3.19 percent a year ago.
Home equity rates unchanged
The average variable rate on home equity lines of credit (HELOC) was unchanged at 4.60 percent this week. The rate averaged 4.66 percent a year ago. The lowest HELOC rate was 2.50 percent and the high, 8.50 percent.
The average FRM rate on 15-year home equity loans was unchanged for the third consecutive week at 6.12 percent. Rates ranged from 2.50 percent to 9.95 percent. The average was 6.40 percent a year ago.
Erate's National APR (annual percentage rates) numbers are tallied from the interest rates of some 200 mortgage originators nationwide.
Freddie Mac: Spring economy brings lower mortgage rates
by Corbin Perkins
DeadlineNews.Com
(3/21/2013) - Freddie Mac's March Outlook calls for 30-year fixed mortgage rates to remain below 4 percent all year and interest rates cooperated this week, dipping near the 3.5 percent mark.
The average rate on the 30-year fixed-rate mortgage (FRM) came in at 3.54 percent, with an average 0.8 point, the week ending March 21, according to Freddie Mac's weekly Primary Mortgage Market Survey.
Last week, the 30-year FRM averaged 3.63 percent. It was 4.08 percent a year ago.
"Low and stable inflation is placing downward pressure on fixed mortgage rates. Annual growth in the consumer price index has remained at or below 2 percent for the past four months, and for the producer price index, even lower," said Frank Nothaft, vice president and chief economist at Freddie Mac.
"This, in part, is why the Federal Reserve monetary policy committee on March 20th lowered the upper end of its inflation forecast for 2013," Nothaft added.
Meanwhile, the average interest rate on the 15-year FRM was 2.72 percent, with an average 0.7 point, for the week ending March 21, down from last week when it averaged 2.79. A year ago, the 15-year FRM averaged 3.30 percent.
For the 5-year Treasury-indexed hybrid adjustable rate mortgage (ARM), the average interest rate was 2.61 percent, with an average 0.6 point, unchanged from last week, and down from the average 2.96 percent a year ago.
Finally, for the week ending March 21, Freddie Mac reported the 1-year Treasury-indexed ARM averaged 2.63 percent, with an average 0.4 point, down from 2.64 percent last week, and down from 2.84 percent a year ago.
Benchmark mortgage interest rates seesaw back down
by Broderick Perkins
DeadlineNews.Com
(3/19/2013) – Mortgage rates continued their up-one-week-down-the-next trend, unable, like consumers, to get a fix on the economy, according to the Erate Interest Rate Update for the week ending March 19.
The average 30-year, conforming mortgage interest rate fell to 3.81 percent, down from 3.88 percent, the week ending March 19.
Erate reported the 30-year rate ranged from 3.32 percent to 5.38 percent for the week. A year ago, the rate was 4.23 percent.
The average rate for the 15-year fixed rate mortgage (FRM), 2.95 percent, also fell, from 3.02 percent a week ago, according to Erate.com, a financial information publisher and interest rate tracker since 1999.
The high and low 15-year FRM rates came in at 4.20 percent and 2.34 percent, respectively. A year ago, the rate averaged 3.47 percent.
Interest rate see-sawing mirrors consumers' doubts about the economy.
In a CNN/ORC poll of consumers, 55 percent of those surveyed said it would be a bad idea, while 43 percent thought it would be a good idea to invest in stocks if they had $1,000 to spend.
The poll was conducted immediately after eight consecutive days of record high closes for the Dow Industrial average.
Despite the housing recovery, improved employment and wages, the poll also found that only 31 percent of consumer thought the economy was either good or very good, while 69 percent said the economy was either poor or very poor.
It's not surprising mortgage interest rates don't know which way is up – or down.
Meanwhile, Erate reported the average interest rate for the 30-year jumbo loan came down to 4.04 percent, for the week ending March 19, from 4.10 percent, a week earlier. The rate was 4.73 percent a year ago. The spread ranged from 3.42 percent, at the low end, to 6.33 percent at the high end.
Also, the average interest rate for the 5/1 ARM came in at 2.90 percent, down from 2.93 percent last week. The lowest 5/1 ARM rate this week was 2.42 percent and the high 4.08 percent. The rate was 3.22 percent a year ago.
Home equity rates flat
The average variable rate on home equity lines of credit (HELOC) dropped a notch from 4.61 percent last week to 4.60 percent this week. The rate averaged 4.66 percent a year ago. The lowest HELOC rate was 2.50 percent and the high, 8.50 percent.
The average FRM rate on 15-year home equity loans remained flat at 6.12 percent for the second consecutive week. Rates ranged from 2.50 percent to 9.95 percent. The average was 6.40 percent a year ago.
Erate's National APR (annual percentage rates) numbers are tallied from the interest rates of some 200 mortgage originators nationwide.
Strengthening economy pushes up most mortgage rates
(3/14/2013) – More jobs and an increase in retail sales both helped offset the economic impact of the end of the payroll tax holiday and helped boost rates higher.
The average rate on the 30-year fixed-rate mortgage (FRM) was up to 3.63 percent, with an average 0.8 point, the week ending March 14, compared to last week's 3.52 percent average, according to Freddie Mac's weekly Primary Mortgage Market Survey.
Last year at this time, the rate averaged 3.92 percent.
The average interest rate on the 15-year FRM was also up, to 2.79 percent, with an average 0.8 point, compared to 2.76 last week. A year ago, the 15-year FRM averaged 3.16 percent.
"Fixed mortgage rates rose this week on stronger signs of jobs growth and consumer spending. The economy added 236,000 new workers in February which helped push down the unemployment rate to 7.7 percent," said Frank Nothaft, vice president and chief economist at Freddie Mac.
"This helped offset the effects of the payroll tax holiday expiration and led to a 1.1 percent increase in retail sales, which was well above the market consensus forecast," Nothaft added.
For the 5-year Treasury-indexed hybrid adjustable rate mortgage (ARM), the average interest rate was 2.61 percent, with an average 0.6 point, down from 2.63 last week, and down from the average 2.83 percent a year ago.
Finally, for the week ending March 14, Freddie Mac reported the 1-year Treasury-indexed ARM averaged 2.64 percent, with an average 0.3 point, up from 2.63 percent last week, and down from 2.79 percent a year ago.
Benchmark mortgage interest rates rise, home equity rates flat
(3/12/2013) – Economic growth, especially in the employment sector, sent all four benchmark mortgage rates up the week ending March 12, according to the Erate Interest Rate Update.
The average 30-year mortgage interest rate rose to 3.88 percent, up from 3.72 percent last week.
Erate reported the 30-year conforming rate ranged from 3.32 percent to 5.38 percent for the week. A year ago, the rate was 4.13 percent.
Meanwhile, the average rate for the 15-year fixed rate mortgage (FRM) also rose to 3.02 percent, up from 2.94 percent last week, according to Erate.com, a financial information publisher and interest rate tracker since 1999.
The high and low 15-year FRM rates were also both up to 5.08 percent and 2.55 percent, respectively. A year ago, the rate averaged 3.38 percent.
Rates rose on good economic news
Rates were buoyed by the U.S. economy adding 236,000 jobs in February, according, much stronger than in January's addition of 119,000 workers, according to the U.S. Labor Department.
The gains, pushing the unemployment rate down to 7.7 percent, were broad-based with offices, restaurants and hospitals adding jobs, but construction gave the economy a big boost.
The housing construction industry added 48,000 new jobs in February and 151,000 jobs over the last five months. That's the industry's best hiring boost since the 2006 housing bubble.
Meanwhile, Erate reported the average interest rate for the 30-year jumbo loan moved up to 4.10 percent, for the week ending March 12, from 4.02 percent, a week earlier. The rate was 4.64 percent a year ago. The spread ranged from 3.45 percent, at the low end, to 6.33 percent at the high end.
Also finally moving up was the average interest rate for the 5/1 ARM. It came in at 2.93 percent, the week ending March 12, up from 2.91 percent last week. The lowest 5/1 ARM rate this week was 2.42 percent and the high 4.08 percent. The rate was 3.17 percent a year ago.
Home equity rates flat
The average variable rate on home equity lines of credit (HELOC) was unchanged at 4.61 percent. The rate averaged 4.66 percent a year ago. The lowest HELOC rate was 2.50 percent and the high, 8.50 percent.
The average FRM rate on 15-year home equity loans was also flat at 6.12 percent, the week ending March 12. Rates ranged from 2.50 percent to 9.95 percent. The average was 6.42 percent a year ago.
Erate's National APR (annual percentage rates) numbers are tallied from the interest rates of some 200 mortgage originators nationwide.
Mortgage rates unexpectedly mixed this week
(3/7/2013) – While the Erate Update for March 5 saw the mixed economy pushing all benchmark rates down, Freddie Mac revealed a mixed bag of interest rates.
The average rate on the 30-year fixed-rate mortgage (FRM) came in at 3.52 percent, with an average 0.7 point, the week ending March 7, according to Freddie Mac's weekly Primary Mortgage Market Survey.
That was up from last week's 3.51 percent average. A year ago, the rate averaged 3.88 percent.
The average interest rate on the 15-year FRM was 2.76 percent, with an average 0.7 point, unchanged from last week. A year ago, the 15-year FRM averaged 3.13 percent.
On the other hand, for the 5-year Treasury-indexed hybrid adjustable rate mortgage (ARM), the average interest rate was 2.63 percent, with an average 0.5 point, up from 2.61 percent last week, and down from the average 2.81 percent a year ago.
Finally, for the week ending March 7, Freddie Mac reported the 1-year Treasury-indexed ARM averaged 2.63 percent, with an average 0.3 point, down from 2.64 percent last week, and down from 2.73 percent a year ago.
Benchmark mortgage interest rates trend down
(3/5/2013) – Widely mixed economic indicators left mortgage interest rates with nowhere to go but down.
All four benchmark mortgage rates dropped, the week ending March 5, including the 15-year fixed rate mortgage (FRM) and the 5/1 adjustable rate mortgage (ARM).
Both had been stubbornly stuck since early February, according to the Erate Interest Rate Update.
The average 30-year mortgage interest rate dropped to 3.72 percent, down from last week's 3.76 percent average.
Erate said the 30-year conforming rate ranged from 3.32 percent to 5.38 percent for the week. A year ago, the rate was 4.14 percent.
Meanwhile, the average rate for the 15-year fixed rate mortgage (FRM) finally dropped to 2.94 percent, after being stuck at 2.98 percent for the past month, according to Erate.com, a financial information publisher and interest rate tracker since 1999.
The high and low 15-year FRM rates were 4.61 percent and 2.52 percent, respectively. A year ago, the rate averaged 3.39 percent, according to Erate.
Rates fell on widely mixed economic indicators.
On the upside, existing and new homes sales rose in January, building permits hit their highest level in four years and the bull ran the stock market as the Dow Jones average reached its highest level since 2007.
On the downside, Fiscal Cliff II arrived with government spending cuts, the payroll tax got a hike and gas prices, now due to fall, rose 10 percent in February.
Meanwhile, Erate reported the average interest rate for the 30-year jumbo loan moved down to 4.02 percent, for the week ending March 5, from 4.08 percent, a week earlier. The rate was 4.64 percent a year ago. The spread ranged from 3.42 percent, at the low end, to 6.33 percent at the high end.
Also finally moving down was the average interest rate for the 5/1 ARM. It came in at 2.94 percent, the week ending March 5 after sticking at 2.98 percent for four weeks. The lowest 5/1 ARM rate this week was 2.42 percent and the high 4.08 percent. The rate was 3.17 percent a year ago.
Home equity rates rise
On the other hand, both home equity rates were on the rise.
The average variable rate on home equity lines of credit (HELOC), at 4.61 percent was up from an average 4.60 percent last week. The rate averaged 4.68 percent a year ago. The lowest HELOC rate was 2.50 percent and the high, 8.50 percent.
The average FRM rate on 15-year home equity loans was up to 6.12 percent, compared to 6.10 percent a week ago. Rates ranged from 2.50 percent to 9.95 percent. The average was 6.43 percent a year ago.
Erate's National APR (annual percentage rates) numbers are tallied from the interest rates of some 200 mortgage originators nationwide.


