Real Estate Market
Burns Consulting: Lagging indicators may have cost buyers bottom-market buys
by Broderick Perkins
(3/27/2012) - If you've been waiting for the housing market to hit bottom, you may have waited too long.
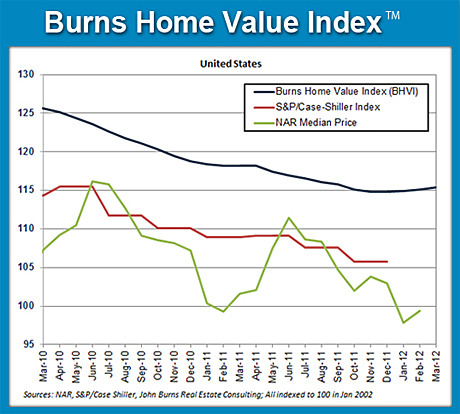
John Burns Consulting reported this week, buyers seeking the greatest bottom market bargains may have missed the boat if they used as their guide home price trends reported by the National Association of Realtors, Federal Housing Finance Agency (FHFA), S&P/Case-Shiller and others.
The "Burns Home Index" reveals home prices have been rising for three months in 90 of the 97 markets it tracks.
Other indicators show price improvements only in the last month, at best.

Burns says the average price increase over the past three months has been 1.1 percent, or a relatively amazing 4.5 percent annual rate.
"This is big news, so why isn't anyone else reporting it? It is because most price indexes are at least 3 months behind what's happening with home prices right now," says Burns' blogger Wayne Yamano.
If Burns is accurate, that news is on fire.
It comes at a time when another lagging indicator reports affordability hasn't been what it's cracked up to be. And that means missing the bottom could be even more costly for fence sitting buyers.
Affordability is relative
During the housing crash, many markets saw home prices slashed by as much as 50 percent in some of the hardest hit areas, especially when foreclosed and other distressed properties were tossed into the mix. With mortgage rates at record lows the market should be screaming "affordability."
In one measure, from 2008 to 2010, housing costs fell an average 2 percent, but household income fell more than twice as much, by 5 percent, according to the Center For Housing Policy's (CHP) "Housing Landscape, 2012."
Unemployment and under-employment has had more impact on affordability then lower home prices and cheap interest rates, according to the National Association of Home Builders' (NAHB) new "Priced-Out Effect" report.
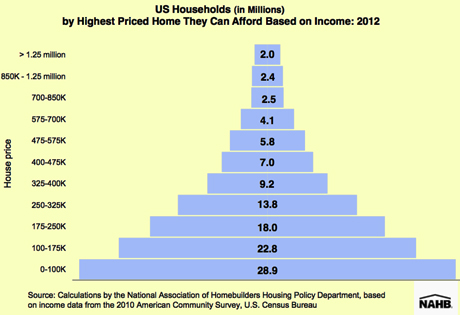
According to the report, the majority of Americans can only afford homes that cost less than $175,000. Nearly one in three can only afford something for less than $100,000.
NAHB's Priced-Out study translates U.S. Census Bureau-American Community Survey household income data into the distribution of homes that U.S. households can afford in various price ranges.
The model estimates how many households can qualify for a new home mortgage before and after a house price increase. The resulting difference is the number priced-out households.
Displayed as a pyramid of affordability, with less-expensive homes at the base, the model reveals a crowded base where a large number of households have relatively modest incomes. As the price of a home goes up, the pyramid narrows, climbing with fewer and fewer households in each tier able to afford higher priced homes.

Based on conventional assumptions and underwriting standards that included a 10 percent down payment, it takes an income of about $26,430 to purchase a $100,000 home, according to the NAHB.
In 2012, about 28.9 million households in the U.S. are estimated to have incomes lower than that threshold and, therefore, can only afford to buy homes priced under $100,000.
These 28.9 million households form the bottom step of the pyramid. Of the remaining 87.5 million who can afford a home priced at $100,000, 23.3 million can only afford to pay a top price of somewhere between $100,000 and $175,000.
Together, those who can afford housing priced at or below $175,000 make up nearly 52 percent of all households.
Toss in the $175,000 to $250,000 level, add the additional 18 percent of households who can afford that bracket and affordability for homes at $250,000 and below reaches nearly 70 percent of households.
At the peak of the pyramid, where the 1 Percenters live, only 2 percent of households can afford to buy.
Not that there's any love lost way up there.
Follow the link to continue reading the related articles
National Mortgage Settlement controversy, related scams, offset by helpful consumer guides
Housing poised to recover, boosts economy, stock market
Home prices fall, but so does spending power
REO 'land rush' opens with prequalification period for investors
Midwest lagging as Clear Capital forecasts 2012 home price gain
Fannie Mae & Jumbo Mortgage Rates
Just One Click! = Current Rate Chart


